- Syllabus
- 1 Introduction
- 2 Data in Biology
- 3 Preliminaries
- 4 R Programming
- 4.1 Before you begin
- 4.2 Introduction
- 4.3 R Syntax Basics
- 4.4 Basic Types of Values
- 4.5 Data Structures
- 4.6 Logical Tests and Comparators
- 4.7 Functions
- 4.8 Iteration
- 4.9 Installing Packages
- 4.10 Saving and Loading R Data
- 4.11 Troubleshooting and Debugging
- 4.12 Coding Style and Conventions
- 4.12.1 Is my code correct?
- 4.12.2 Does my code follow the DRY principle?
- 4.12.3 Did I choose concise but descriptive variable and function names?
- 4.12.4 Did I use indentation and naming conventions consistently throughout my code?
- 4.12.5 Did I write comments, especially when what the code does is not obvious?
- 4.12.6 How easy would it be for someone else to understand my code?
- 4.12.7 Is my code easy to maintain/change?
- 4.12.8 The
stylerpackage
- 5 Data Wrangling
- 6 Data Science
- 7 Data Visualization
- 8 Biology & Bioinformatics
- 8.1 R in Biology
- 8.2 Biological Data Overview
- 8.3 Bioconductor
- 8.4 Microarrays
- 8.5 High Throughput Sequencing
- 8.6 Gene Identifiers
- 8.7 Gene Expression
- 8.7.1 Gene Expression Data in Bioconductor
- 8.7.2 Differential Expression Analysis
- 8.7.3 Microarray Gene Expression Data
- 8.7.4 Differential Expression: Microarrays (limma)
- 8.7.5 RNASeq
- 8.7.6 RNASeq Gene Expression Data
- 8.7.7 Filtering Counts
- 8.7.8 Count Distributions
- 8.7.9 Differential Expression: RNASeq
- 8.8 Gene Set Enrichment Analysis
- 8.9 Biological Networks .
- 9 EngineeRing
- 10 RShiny
- 11 Communicating with R
- 12 Contribution Guide
- Assignments
- Assignment Format
- Starting an Assignment
- Assignment 1
- Assignment 2
- Assignment 3
- Problem Statement
- Learning Objectives
- Skill List
- Background on Microarrays
- Background on Principal Component Analysis
- Marisa et al. Gene Expression Classification of Colon Cancer into Molecular Subtypes: Characterization, Validation, and Prognostic Value. PLoS Medicine, May 2013. PMID: 23700391
- Scaling data using R
scale() - Proportion of variance explained
- Plotting and visualization of PCA
- Hierarchical Clustering and Heatmaps
- References
- Assignment 4
- Assignment 5
- Problem Statement
- Learning Objectives
- Skill List
- DESeq2 Background
- Generating a counts matrix
- Prefiltering Counts matrix
- Median-of-ratios normalization
- DESeq2 preparation
- O’Meara et al. Transcriptional Reversion of Cardiac Myocyte Fate During Mammalian Cardiac Regeneration. Circ Res. Feb 2015. PMID: 25477501l
- 1. Reading and subsetting the data from verse_counts.tsv and sample_metadata.csv
- 2. Running DESeq2
- 3. Annotating results to construct a labeled volcano plot
- 4. Diagnostic plot of the raw p-values for all genes
- 5. Plotting the LogFoldChanges for differentially expressed genes
- The choice of FDR cutoff depends on cost
- 6. Plotting the normalized counts of differentially expressed genes
- 7. Volcano Plot to visualize differential expression results
- 8. Running fgsea vignette
- 9. Plotting the top ten positive NES and top ten negative NES pathways
- References
- Assignment 6
- Assignment 7
- Appendix
- A Class Outlines
5.9 Rearranging Data
Sometimes the shape and format of our data is not the most convenient for
performing certain operations on it, even if it is tidy. Let’s say
we are considering the range of statistics that were computed for all of our
genes in the gene_stats tibble, and wanted to compute the average statistic
over all genes for both tests. Recall our tibble has separate columns for each
test:
gene_stats <- tribble(
    ~gene, ~test1_stat, ~test1_p, ~test2_stat, ~test2_p,
   "APOE",   12.509293,   0.1032,   34.239521,   1.3e-5,
  "HOXD1",    4.399211,   0.6323,   16.332318,   0.0421,
   "SNCA",   45.748431,   4.2e-9,    0.757188,   0.9146,
)
gene_stats
## # A tibble: 3 x 5
## gene test1_stat test1_p test2_stat test2_p
## <chr> <dbl> <dbl> <dbl> <dbl>
## 1 APOE 12.5 0.103 34.2 0.000013
## 2 HOXD1 4.40 0.632 16.3 0.0421
## 3 SNCA 45.7 0.0000000042 0.757 0.915For convenience, we desire our output to be in table form, with one row per test and the statistics for each test as columns. We could do this manually like so:
tribble(
   ~test_name, ~min, ~mean, ~max,
   "test1_stat", min(gene_stats$test1_stat), mean(gene_stats$test1_stat), max(gene_stats$test1_stat),
   "test2_stat",  min(gene_stats$test2_stat), mean(gene_stats$test2_stat), max(gene_stats$test2_stat),
)
## # A tibble: 2 x 4
## test_name min mean max
## <chr> <dbl> <dbl> <dbl>
## 1 test1_stat 4.40 20.9 45.7
## 2 test2_stat 0.757 17.1 34.2This gets the job done, but is clearly very ugly, error prone, and would require significant work if we later added more statistics columns.
Instead of typing out the values we desire manually, we can pivot our tibble
using the tidyr::pivot_longer() function, so that the column values are placed
in a new column and the corresponding values are placed in yet another column.
This process is illustrated in the following figure:
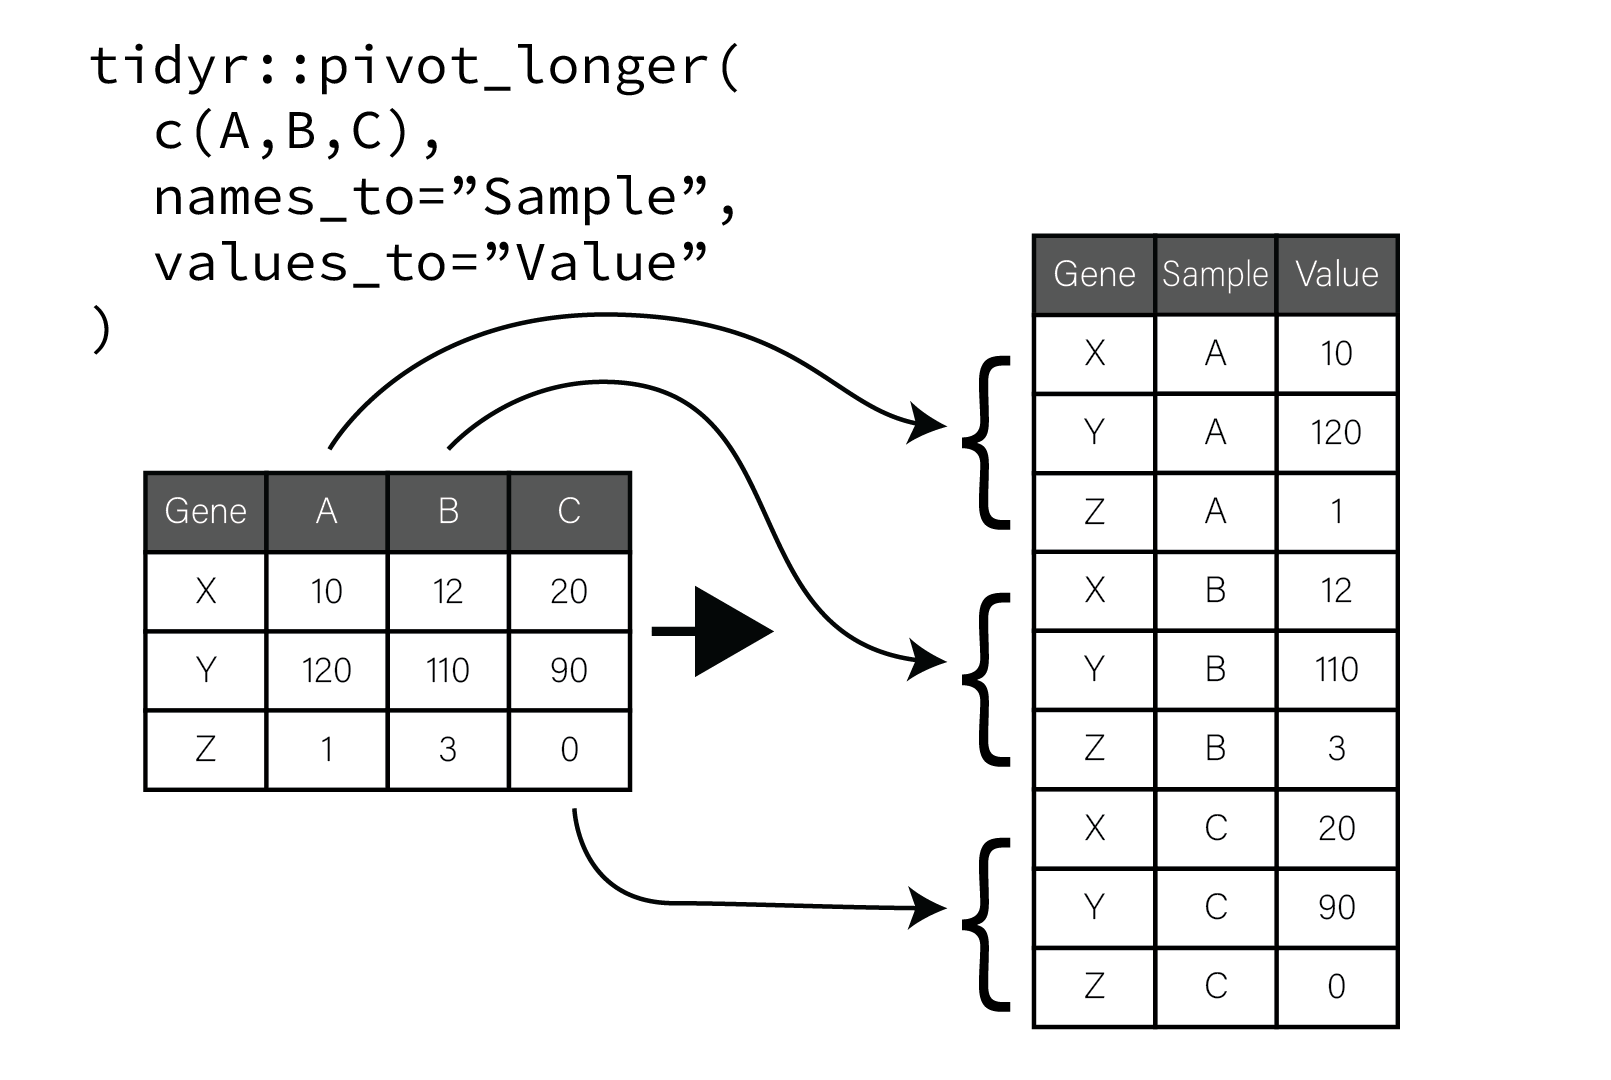
Pivot longer moves columns and values to two new columns
In the figure, the original tibble has genes along rows and samples as columns. When the sample columns are pivoted, the value of each column name is placed in a new column named “Sample” and repeated for as many rows there are in the tibble. A second new column “Value” is populated with the corresponding values that were in each column. The gene associated with each value is preserved and repeated vertically until all the table columns and values have been pivoted. This process of pivoting transforms the tibble into so called “long” form.
Returning to our gene_stats example, we can apply some operations to the
tibble to easily perform the summarization we did above in a much more
expressive manner:
long_gene_stats <- tidyr::pivot_longer(
  gene_stats,
  ends_with("_stat"),
  names_to="test",
  values_to="stat"
)
long_gene_stats
## # A tibble: 6 x 5
## gene test1_p test2_p test stat
## <chr> <dbl> <dbl> <chr> <dbl>
## 1 APOE 0.103 0.000013 test1_stat 12.5
## 2 APOE 0.103 0.000013 test2_stat 34.2
## 3 HOXD1 0.632 0.0421 test1_stat 4.40
## 4 HOXD1 0.632 0.0421 test2_stat 16.3
## 5 SNCA 0.0000000042 0.915 test1_stat 45.7
## 6 SNCA 0.0000000042 0.915 test2_stat 0.757We see that now instead of having X_stat columns, the column names and their
values have been put into the test and stat columns, respectively. Now to
summarize the statistics for each test, we simply do a group_by() on the
test column and compute summaries on the stat column:
long_gene_stats %>%
  dplyr::group_by(test) %>%
  dplyr::summarize(min = min(stat), mean = mean(stat), max = max(stat))
## # A tibble: 2 x 4
## test min mean max
## <chr> <dbl> <dbl> <dbl>
## 1 test1_stat 4.40 20.9 45.7
## 2 test2_stat 0.757 17.1 34.2You may verify that the numbers are identical in this pivoted tibble as the one
we manually created earlier. This pivoting method will produce the desired
output regardless of the number of tests we include the table, so long as the
column names end in "_test".
The inverse of pivot_longer() is
pivot_wider(). If
you have variables gathered in single columns like that produced by
pivot_longer() you can reverse the process with this function to create a
tibble with those variables as columns.