- Syllabus
- 1 Introduction
- 2 Data in Biology
- 3 Preliminaries
- 4 R Programming
- 4.1 Before you begin
- 4.2 Introduction
- 4.3 R Syntax Basics
- 4.4 Basic Types of Values
- 4.5 Data Structures
- 4.6 Logical Tests and Comparators
- 4.7 Functions
- 4.8 Iteration
- 4.9 Installing Packages
- 4.10 Saving and Loading R Data
- 4.11 Troubleshooting and Debugging
- 4.12 Coding Style and Conventions
- 4.12.1 Is my code correct?
- 4.12.2 Does my code follow the DRY principle?
- 4.12.3 Did I choose concise but descriptive variable and function names?
- 4.12.4 Did I use indentation and naming conventions consistently throughout my code?
- 4.12.5 Did I write comments, especially when what the code does is not obvious?
- 4.12.6 How easy would it be for someone else to understand my code?
- 4.12.7 Is my code easy to maintain/change?
- 4.12.8 The
stylerpackage
- 5 Data Wrangling
- 6 Data Science
- 7 Data Visualization
- 8 Biology & Bioinformatics
- 8.1 R in Biology
- 8.2 Biological Data Overview
- 8.3 Bioconductor
- 8.4 Microarrays
- 8.5 High Throughput Sequencing
- 8.6 Gene Identifiers
- 8.7 Gene Expression
- 8.7.1 Gene Expression Data in Bioconductor
- 8.7.2 Differential Expression Analysis
- 8.7.3 Microarray Gene Expression Data
- 8.7.4 Differential Expression: Microarrays (limma)
- 8.7.5 RNASeq
- 8.7.6 RNASeq Gene Expression Data
- 8.7.7 Filtering Counts
- 8.7.8 Count Distributions
- 8.7.9 Differential Expression: RNASeq
- 8.8 Gene Set Enrichment Analysis
- 8.9 Biological Networks .
- 9 EngineeRing
- 10 RShiny
- 11 Communicating with R
- 12 Contribution Guide
- Assignments
- Assignment Format
- Starting an Assignment
- Assignment 1
- Assignment 2
- Assignment 3
- Problem Statement
- Learning Objectives
- Skill List
- Background on Microarrays
- Background on Principal Component Analysis
- Marisa et al. Gene Expression Classification of Colon Cancer into Molecular Subtypes: Characterization, Validation, and Prognostic Value. PLoS Medicine, May 2013. PMID: 23700391
- Scaling data using R
scale() - Proportion of variance explained
- Plotting and visualization of PCA
- Hierarchical Clustering and Heatmaps
- References
- Assignment 4
- Assignment 5
- Problem Statement
- Learning Objectives
- Skill List
- DESeq2 Background
- Generating a counts matrix
- Prefiltering Counts matrix
- Median-of-ratios normalization
- DESeq2 preparation
- O’Meara et al. Transcriptional Reversion of Cardiac Myocyte Fate During Mammalian Cardiac Regeneration. Circ Res. Feb 2015. PMID: 25477501l
- 1. Reading and subsetting the data from verse_counts.tsv and sample_metadata.csv
- 2. Running DESeq2
- 3. Annotating results to construct a labeled volcano plot
- 4. Diagnostic plot of the raw p-values for all genes
- 5. Plotting the LogFoldChanges for differentially expressed genes
- The choice of FDR cutoff depends on cost
- 6. Plotting the normalized counts of differentially expressed genes
- 7. Volcano Plot to visualize differential expression results
- 8. Running fgsea vignette
- 9. Plotting the top ten positive NES and top ten negative NES pathways
- References
- Assignment 6
- Assignment 7
- Appendix
- A Class Outlines
10.2 Application Structure
R Shiny applications are split into two sections: the UI and the server. In web development, these are usually known as the front end and the back end. The front end is the portion of the application that deal with the users. This is the web page, the design, the login screen, the code that controls what the user can see and do. The back end is everything the user doesn’t see, the structure behind the web page that supports functionality: the database, processing data. One Shiny application controls both aspects of this paradigm. The UI creates a simple web page and allows for customizable inputs and control of displays, the server manages those inputs and transforms them into outputs the user can see.
In many cases the front end runs on the user’s machine (web browser) and the back end lives on another computer, usually a server. In development of a Shiny app these will be on the same machine, but if you wish to actually publish your web page for others to use then the application will run on a server and communicate with a user elsewhere.
A simple example
library(shiny)
ui <- fluidPage("Hello, worm!")
server <- function(input, output, session) { }
shinyApp(ui, server)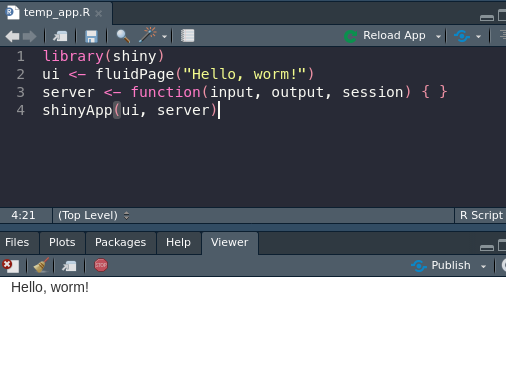
Example app
This is the simplest Shiny app structure, which displays the text we pass into UI (the front end) and then doing absolutely nothing else (relatable). The first line loads R Shiny as a package, the second creates our simple user interface and text output, line three controls the back end (which again, does nothing), and the final line launches our app using the objects created in lines two and three.
In order to build some actual content in our app, we’ll first look at the UI, what the user sees.
10.2.1 UI Design
Much like the rest of the content in this course (and I’m sure you’re sick of hearing this), user interfaces and user design could be taught as its own course. There are innumerable ways for people to interact with software, and designing that software to make them the least angry possible is now your focus.
R Shiny makes designing what a user sees fairly easy for us. Gone are the days of opening up a text editor to tweak HTML tags, we can just use built in functions like span() and div() to organize our page.
For example, copying our above extra simple app, I could paste in a whole text block to get a new line of text:
ui <- fluidPage(
  paste("Nothing beside remains. Round the decay",
  "Of that colossal wreck, boundless and bare",
  "The lone and level sands stretch far away.")
)
Not great appearance-wise
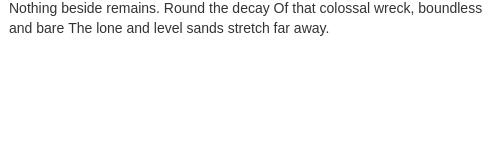
But that’s all rather clunky. And what if I want to include some other elements in between? Or an image, a link? We can do better than just a big block of text next to some plots. Instead we can use p() tags, short for paragraph, to split things up more reasonably and add more convenient customization:
ui <- fluidPage(
  p("Nothing beside remains. Round the decay"),
  p("Of that colossal wreck, boundless and bare"),
  img(src="https://coloringhome.com/coloring/RiA/yEj/RiAyEjzKT.gif",
      style="width:300px;height:200px;"),
  p("The lone and level sands stretch far away."),
  markdown(">Percy Bysshe Shelley")
)
Finally, some good poetry
We still need to include commas at the end, since these tags are essentially arguments being passed to the fluidPage() function. This is not the case for the server side object, which is a normal function and will be split up by line breaks.
Much nicer! This Shelley tribute page is really coming together. Let’s talk about some specific interactive elements that we can use to actually work with the user!
Exercise 1 - UI Functions
Let’s try out some HTML tags. Go to this link to see all of the options! Play around with trying to display some in your app.
library(shiny)
ui <- fluidPage(
  p("This is an easy paragraph"),
  br(), # this is a line break
  h1("A big heading"),
  h6("A small heading")
)
server <- function(input, output, session) { }
shinyApp(ui, server)
10.2.1.1 Inputs
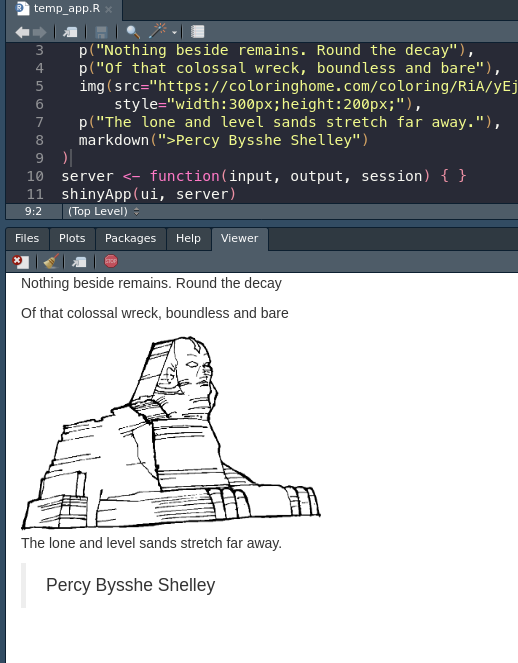
Built-in inputs are one of the major draws to Shiny. Instead of dealing with fickle JavaScript and the DOM (a.k.a. we get to skip half of BF768), we get to type one line of R code and it is all taken care of for us!
ui <- fluidPage(
  sliderInput(inputId = "pyramids", min = 0, max = 10,
              label = "How many pyramids are there?", value = 0, step = 1)
)
Let’s break down this function very quickly:
1. inputId = - The input ID is the string of text (unique, no numbers or special characters) that we can use inside the server function to identify this input. If I want to know how many pyramids the user selected, then I can call input$pyramids. More on this later.
2. max =, min = - Controls the upper and lower bounds of the slider.
3. label = - Text to display to the user about the slider.
4. value = - What value should the slider start at?
5. **step = * - The amount the slider can move by. Useful if more (or less) precise input is required.
The simplest of inputs
The most vital part, and something that all input functions share, is the inputId. This text is used to manage this bit of input data in the server function, and is there for the connection between what the user does and how our app manages it.
ui <- fluidPage(
  dateInput("birthday", "When is your birthday?"),
  fileInput("photo", paste0("Please upload an embarassing photo of you at the ",
                            "Christmas party")),
  radioButtons("button", "Which is your favorite?",
               choices = c("Fall", "Winter", "Spring", "Pyramids"))
)
This generates multiple inputs I can get the results from using input$birthday, input$photo, and input$button.
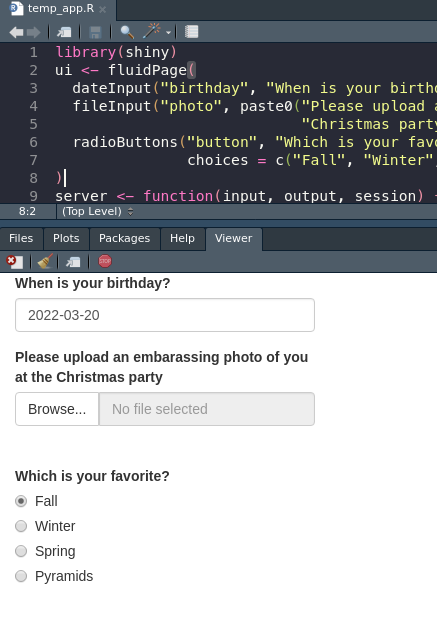
A couple more neat inputs
The results of the file upload are nested. If I were to ask for a CSV, and needed to load that with read.csv(), I would need to use input$csv$datapath to point R at the uploaded object.
For a better idea of the common and useful input options, see the Shiny docs or the cheat sheet. For additional, cooler, fancier input options try shinyWidgets::shinyWidgetsGallery().
10.2.1.2 Outputs
Now that we have a beautiful UI page that takes user input we can figure out where on the page to put it. This part is also relatively easy, every kind of output has a corresponding output function. If I want to insert a base plot or ggplot, I use plotOutput(). A table or data frame or tibble would go through tableOutput().
One advanced option is to use uiOutput() to place input options and HTML back into the front end. This can be used to create some very nice effects, such as inserting results only when one option is selected or spawning a follow up question to an option. Here’s a small example:
library(shiny)
ui <- fluidPage(radioButtons("button", "Peanut butter or jelly?",
                             c("Peanut butter", "Jelly")),
                uiOutput("choice"))
server <- function(input, output, session) {
  output$choice <- renderUI({
    if (input$button == "Peanut butter") {
      radioButtons("pbChoice", "PB is great. Bread or english muffin?",
                   c("Bread", "English Muffin"))
    } else {
      radioButtons("jellychoice", "What kind of jelly?",
        c("Strawberry", "Raspberry", "Toxic sludge"))
    }
  })
}
shinyApp(ui, server)
This is our first example of the server function…doing anything…but we’re gonna ignore exactly what or why it’s doing anything so I can comment on uiOutput(). Based on the if-else statement on line 7, our follow up question changes. This can be used to show/hide responses for users. A user hits a check box indicating they’re a veteran, you can insert more questions about their veteran status or info.
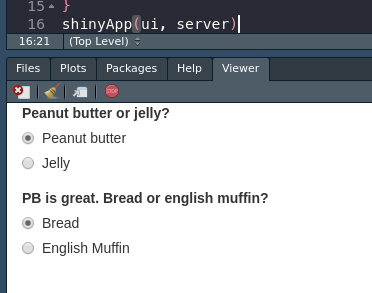
This works way better in RStudio
We will figure out this whole server thing in more detail once we have made our page look as pretty as possible.
10.2.1.3 Sidebar-Main
Now that we have all these functions to populate our page with the most inane content possible, we’re gonna start running into issues with organization. Even with our mastery of HTML elements, it will prove difficult to fit everything we want into one blank page:
ui <- fluidPage(
  HTML(paste(rep("<p>All work and no play makes Jack a dull boy</p>", 1000),
        collapse = ""))
)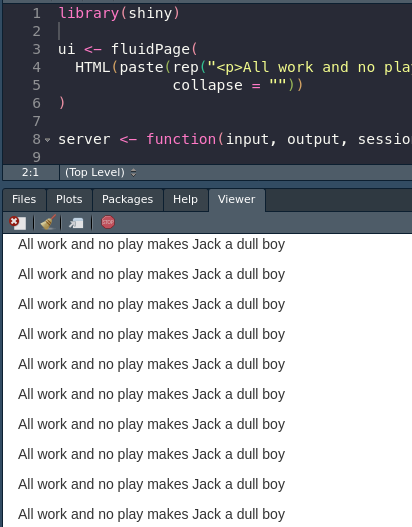
Maybe I’ll stay at a different hotel.
Instead, we can use the popular Sidebar layout to help organize our web page. This works by placing two functions inside the UI argument: sidebarPanel() and mainPanel(). This offers us nice compartmentalization of design without demanding too many arguments or details from us as we put it together. Very useful for quick apps that you don’t need to make look that good. We just need to nest our two panels inside sidebarLayout() like so:
ui <- fluidPage(
  titlePanel("I never get tired of these inane examples."),
  sidebarLayout(
    sidebarPanel(
      HTML(paste(rep("<p>This is the sidebar</p>", 10), collapse = ""))),
    mainPanel(
      h1("and this is the main panel!"))
    ))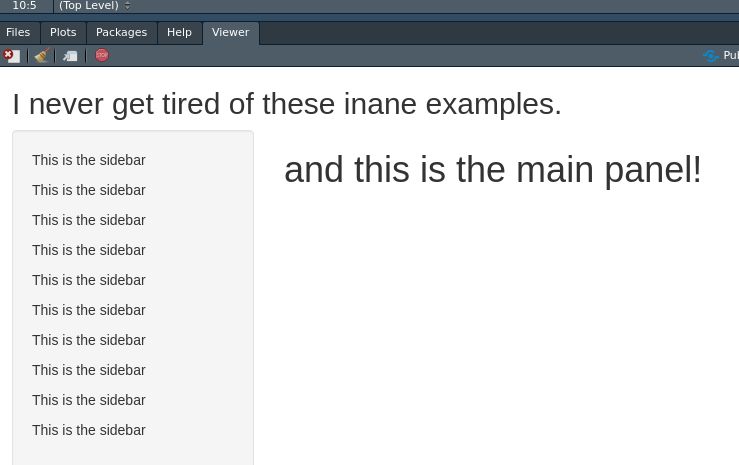
Much better.
We can add other elements, like titlePanel(), to bring the app together. Notice that the title panel is located outside of the sidebarLayout() call, since we don’t want it inside our sidebar or main panel elements. Nesting the functions is the same as the nesting of the layout.
10.2.1.4 FluidPage
There is an alternative to the sidebar-main panel layout, which is a little constricting if you don’t want this super big sidebar taking up everything. The FluidPage (which we have been using as our parent function this whole time! Woa!) can allow for a more grid-like customization of the application.
While there are a lot of ways to control the height and width of your fluid rows, we’ll look at a quick example to see a comically bad example of doing so.
ui <- fluidPage(style = 'background-color: #007BA7',
                fluidRow(style = 'background-color: #F3A712',
                         p("I'm in the first row!"),
                         column(style = 'background-color: #A8C686',
                                width = 4,
                                p("Left columm!")),
                         column(style = 'background-color: #DB162F',
                                width = 8,
                                p("Right column!"))),
                fluidRow(style = 'background-color: #E6BCCD',
                         p("I'm in the second row!"),
                         column(style = 'background-color: #BEE3DB',
                                width=6,
                                p("Left, lower")),
                         column(style = 'background-color: #9D44B5',
                                width=6,
                                p("Right, lower!"))))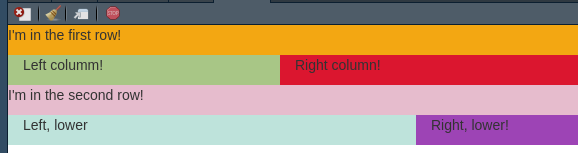
This was very fun lol.
The main gist is that each fluidRow() creates a new row inside whatever function it is, and then you can use the column function inside each row to further split up the page. Then, you can use the same input and output functions inside each of these, along with whatever normal HTML you wish. The overall, standard width of the page is 12 unnamed shiny units, so keep ensure your widths don’t add up to more than 12.
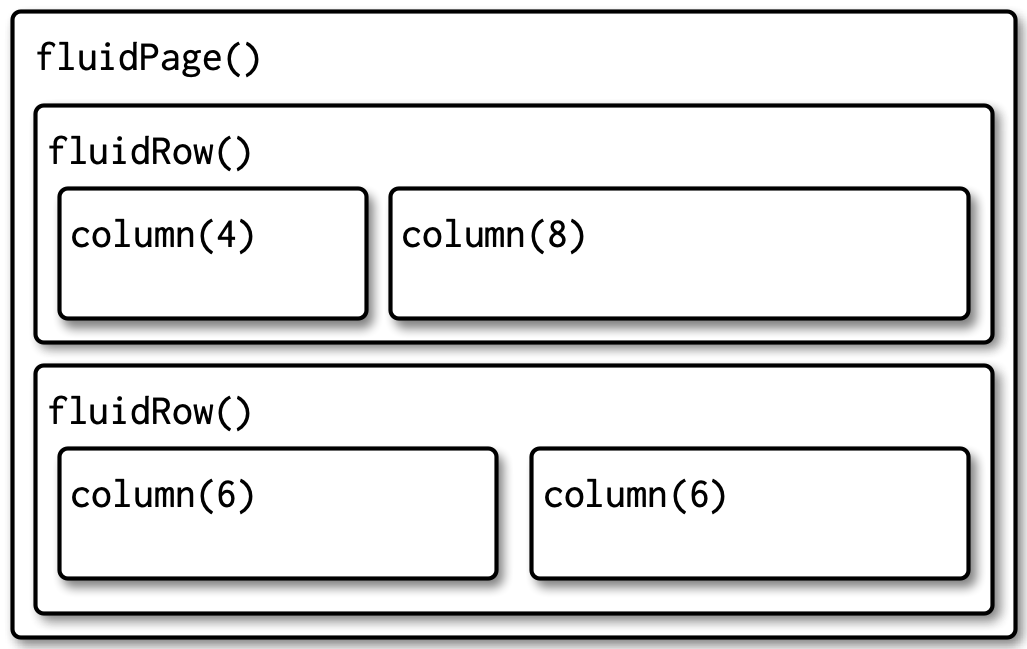
Splitting up a page with fluidRows.
Exercise 2 - FluidPage Collage
Try using fluidPage(), fluidRow(), and column() to create a collage of images! You can easily include an image in your Shiny app using img(src="img.url").
library(shiny)
ui <- fluidPage(
  fluidRow(
    column(width = 6,
           img(src=paste0("https://extension.umn.edu/sites/extension.umn.edu/",
                          "files/styles/caption_medium/public/big-spittle",
                          "bug-fig3_0.jpg?itok=dQJIfJw4"))),
    column(width = 6,
           img(src=paste0("https://www.gardeningknowhow.com/wp-content/uploads",
                          "/2021/05/rhododendron-leafhopper-400x300.jpg")))
  )
)
server <- function(input, output, session) { }
shinyApp(ui, server)
10.2.2 Server Functionality
Once we have a place in the front end, we can start to manipulate the server side to control and run out application. The interface is nothing without the back end it controls; the back end is where we can start to write our R and manipulate data to inform the user.
The server function has two components we worry about: the input, which delivers to us information from the user, and output, which we can pass data and objects to be rendered by our webpage.
library(shiny)
ui <- fluidPage(
  radioButtons("radio", label = "Number of points", choices = c(10, 20)),
  plotOutput("plot")
)
server <- function(input, output, session) {
  output$plot <- renderPlot({
    plot(rnorm(input$radio), 1:input$radio)
  })
}
shinyApp(ui, server)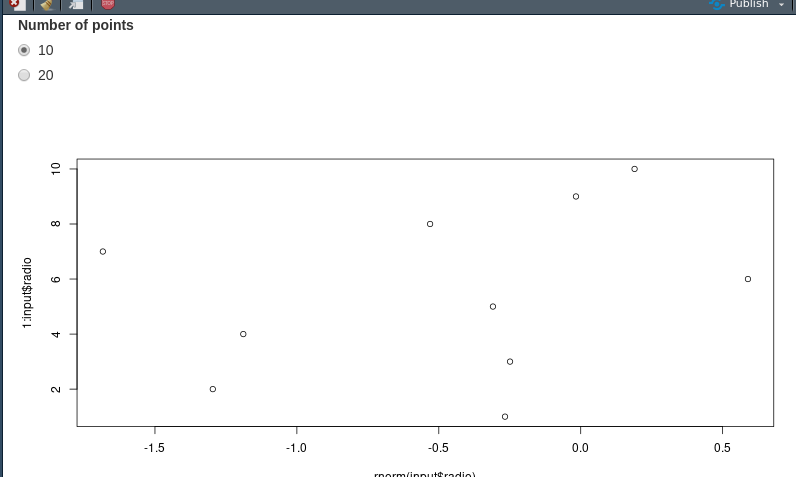
This isn’t ggplot so the default theme is fine.
10.2.2.1 Input
We can pick apart this teeny example application to see how inputs translate to the server function. When we create our radio buttons, we assign the input id “radio.” The application is started and the first choice, 10, is selected by default. That value is immediately entered into the input variable in the server. When a user selects a different option, the new value is updated inside the input variable.
We can reference the input variable inside our server to change our plot in this case. If I select the button for 20 instead of 10, the random number of points put into plot() changes from 10 to 20. The variable is static, so I can use it multiple times in my server function.
10.2.2.2 Output
Finally, the server function delivers this output back to the web interface. In this example, we created a plotOutput() below the radio buttons to display our plot. Inside the server function, we use output$plot to match the output ID we created in plotOutput(). The rendered plot is then inserted into that part of the document. This process of matching IDs mirrors the input process.
Exercise 3 - Inputs and Outputs
Now that you can connect inputs and outputs try to combine a couple! Here is a short list of inputs:
- dateInput()
- radioButtons()
- textInput()
And outputs:
- imageOutput()
- plotOutput()
- textOutput()
See the cheat sheet and docs for more! Here is a little example, try something else:
library(shiny)
ui <- fluidPage(
  textInput("text", "Enter some text"),
  plotOutput("plot")
)
server <- function(input, output, session) {
  output$plot <- renderPlot({
    plot(1, type="n", xlim=c(0, 2), ylim=c(0, 2))
    text(input$text, x = 1, y = 1)
    })
}
shinyApp(ui, server)
There are a number of base outputs types: tables, plots, UI (for additional elements), and so on. There are also additional libraries for elements like maps, networks, and even 3D objects. DataTables are especially useful for sharing data with users.
library(shiny)
library(DT)
ui <- fluidPage(dataTableOutput("dt"))
server <- function(input, output, session) {
  output$dt <- DT::renderDataTable(
    DT::datatable(iris, extensions = 'Buttons', class = "display",
                  options = list(paging = TRUE, searching = TRUE,
                                 fixedColumns = TRUE, autoWidth = TRUE,
                                 ordering = TRUE, dom = 'Bfrtip',
                                 buttons = c('copy', 'csv'))))
  }
shinyApp(ui, server)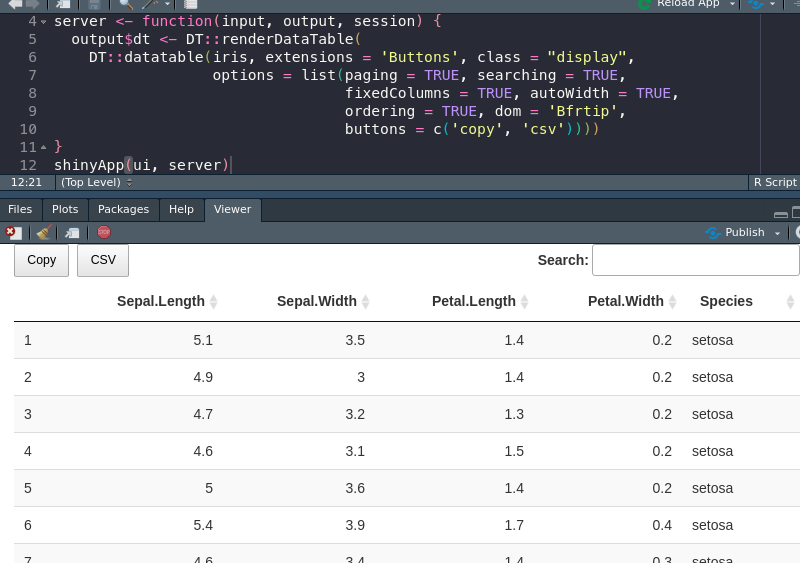
Once I spent like a week trying to get this work and my old boss canned the project ¯\(ツ)/¯
And here is a cool example using a package I’ve never tried before.
library(shiny)
library(threejs)
ui <- fluidPage(
  sliderInput("maxz", "Height of graph", 5, 25, 10),
  scatterplotThreeOutput("scatterplot")
)
server <- function(input, output, session) {
  output$scatterplot <- renderScatterplotThree({
    z <- seq(-10, input$maxz, 0.01)
    x <- cos(z)
    y <- sin(z)
    scatterplot3js(x,y,z, color=rainbow(length(z)))
  })
}
shinyApp(ui, server)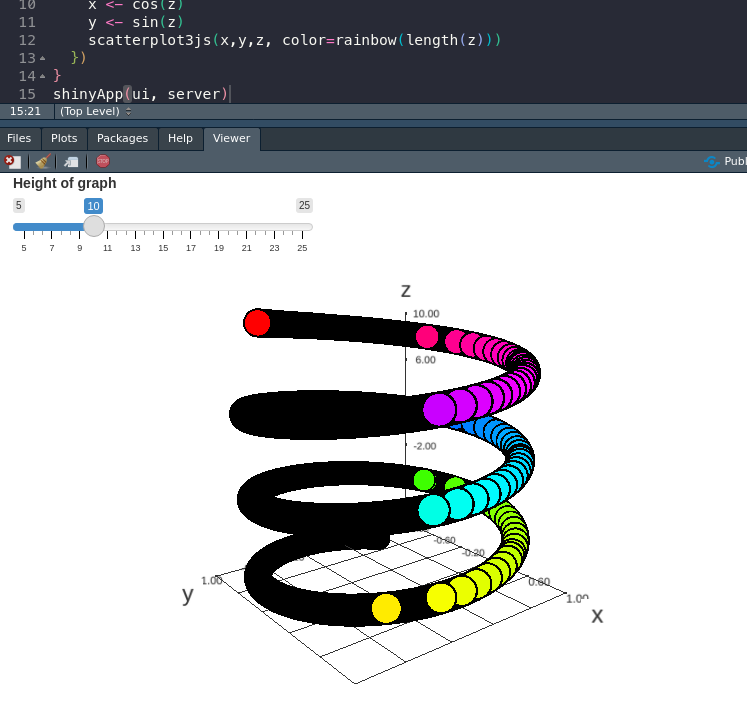
I think there was a toy like this at my doctor’s once
10.2.2.2.1 Traceback
One essential feature for Shiny is determining why errors crop up. You may have some familiarity with this kind of troubleshooting in base R, but because Shiny is abstracting our R into an entire application, the errors can turn into edlritch horrors without compare.
One main tool is automatic, and that is the traceback. When a shiny app fails in a specific way, the error printed lists how the application arrived at that issue. Each function used is listed, in reverse order, from when it was called. In this way, we can track down exactly where our problem lies.
library(shiny)

f <- function(x) g(x)
g <- function(x) h(x)
h <- function(x) x * 2

ui <- fluidPage(
  selectInput("n", "N", 1:10),
  plotOutput("plot")
)
server <- function(input, output, session) {
  output$plot <- renderPlot({
    n <- f(input$n)
    plot(head(cars, n))
  }, res = 96)
}
shinyApp(ui, server)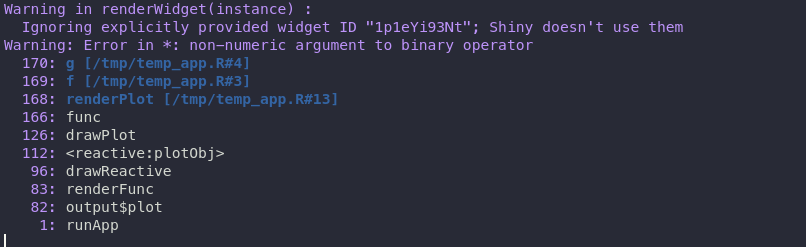
I swear this is more useful than it looks
The above application fails because of the three functions at the beginning.
Now that I know the error is limited to my f() function on line 13, I can do one of two things:
1. I can use a print() statement to try and deduce why this is failing.
2. I can enable the debugger to take a step by step approach to how my code is running.
Debugging…well…you could write a course based on it. However, printing is often a useful quick and dirty technique for parsing your code troubles quickly. Because it sounds like my argument is a problem, and my only input right now is input$n, let me see what that looks like with print(input$n) and print(typeof(input$n)).
A quick as.numeric() will fix my app right up and allow me to plot car data? 🚗 🏎️
Exercise 4 - Print Output
While not the most nuanced debugging strategy, sliding a print() statement into your code is a tried and true method of figuring out what your code is doing. Can you figure out where we can put a print() statement here to see what our input is doing when a button is changed?
library(shiny)
ui <- fluidPage(radioButtons("hey",
                             "woa cool bugs",
                             c("One", "Two")),
                textOutput("out"))
server <- function(input, output, session) {
  output$out <- renderText({
    # ?
  })
}
shinyApp(ui, server)