- Syllabus
- 1 Introduction
- 2 Data in Biology
- 3 Preliminaries
- 4 R Programming
- 4.1 Before you begin
- 4.2 Introduction
- 4.3 R Syntax Basics
- 4.4 Basic Types of Values
- 4.5 Data Structures
- 4.6 Logical Tests and Comparators
- 4.7 Functions
- 4.8 Iteration
- 4.9 Installing Packages
- 4.10 Saving and Loading R Data
- 4.11 Troubleshooting and Debugging
- 4.12 Coding Style and Conventions
- 4.12.1 Is my code correct?
- 4.12.2 Does my code follow the DRY principle?
- 4.12.3 Did I choose concise but descriptive variable and function names?
- 4.12.4 Did I use indentation and naming conventions consistently throughout my code?
- 4.12.5 Did I write comments, especially when what the code does is not obvious?
- 4.12.6 How easy would it be for someone else to understand my code?
- 4.12.7 Is my code easy to maintain/change?
- 4.12.8 The
stylerpackage
- 5 Data Wrangling
- 6 Data Science
- 7 Data Visualization
- 8 Biology & Bioinformatics
- 8.1 R in Biology
- 8.2 Biological Data Overview
- 8.3 Bioconductor
- 8.4 Microarrays
- 8.5 High Throughput Sequencing
- 8.6 Gene Identifiers
- 8.7 Gene Expression
- 8.7.1 Gene Expression Data in Bioconductor
- 8.7.2 Differential Expression Analysis
- 8.7.3 Microarray Gene Expression Data
- 8.7.4 Differential Expression: Microarrays (limma)
- 8.7.5 RNASeq
- 8.7.6 RNASeq Gene Expression Data
- 8.7.7 Filtering Counts
- 8.7.8 Count Distributions
- 8.7.9 Differential Expression: RNASeq
- 8.8 Gene Set Enrichment Analysis
- 8.9 Biological Networks .
- 9 EngineeRing
- 10 RShiny
- 11 Communicating with R
- 12 Contribution Guide
- Assignments
- Assignment Format
- Starting an Assignment
- Assignment 1
- Assignment 2
- Assignment 3
- Problem Statement
- Learning Objectives
- Skill List
- Background on Microarrays
- Background on Principal Component Analysis
- Marisa et al. Gene Expression Classification of Colon Cancer into Molecular Subtypes: Characterization, Validation, and Prognostic Value. PLoS Medicine, May 2013. PMID: 23700391
- Scaling data using R
scale() - Proportion of variance explained
- Plotting and visualization of PCA
- Hierarchical Clustering and Heatmaps
- References
- Assignment 4
- Assignment 5
- Problem Statement
- Learning Objectives
- Skill List
- DESeq2 Background
- Generating a counts matrix
- Prefiltering Counts matrix
- Median-of-ratios normalization
- DESeq2 preparation
- O’Meara et al. Transcriptional Reversion of Cardiac Myocyte Fate During Mammalian Cardiac Regeneration. Circ Res. Feb 2015. PMID: 25477501l
- 1. Reading and subsetting the data from verse_counts.tsv and sample_metadata.csv
- 2. Running DESeq2
- 3. Annotating results to construct a labeled volcano plot
- 4. Diagnostic plot of the raw p-values for all genes
- 5. Plotting the LogFoldChanges for differentially expressed genes
- The choice of FDR cutoff depends on cost
- 6. Plotting the normalized counts of differentially expressed genes
- 7. Volcano Plot to visualize differential expression results
- 8. Running fgsea vignette
- 9. Plotting the top ten positive NES and top ten negative NES pathways
- References
- Assignment 6
- Assignment 7
- Appendix
- A Class Outlines
7.8 Publication Ready Plots
ggplot is powerful and flexible tool for creating plots, but it falls a little short of producing plots directly suitable for publication. This is primarily due to the default styling provided by the package; standard ggplot formatting is effective for examining plots on screens, but some elements, such as the default grey plot background, are unnecessary and sometimes inappropriate for polished plots in printed journals.
There are two ways to take ggplots the final step to publication quality figures. The first is by using themes provided by the ggplot package and customizing specific elements to taste. The second is to export plots to file in Scalable Vector Graphics format, which can then be imported into programs like Adobe Illustrator or Inkscape to be edited further.
7.8.1 ggplot Themes
Themes in ggplot are combinations of styling elements applied to the different components of a chart that include everything except the display and styling of data, which is controlled using geometry and aesthetics. The default theme produces plots with a grey background, a white grid, no charting area frame, and standard axis and tick labels:
base_g <- tibble(
  x=rnorm(100),
  y=rnorm(100)
) %>%
  ggplot(aes(x=x, y=y)) +
  geom_point()

base_g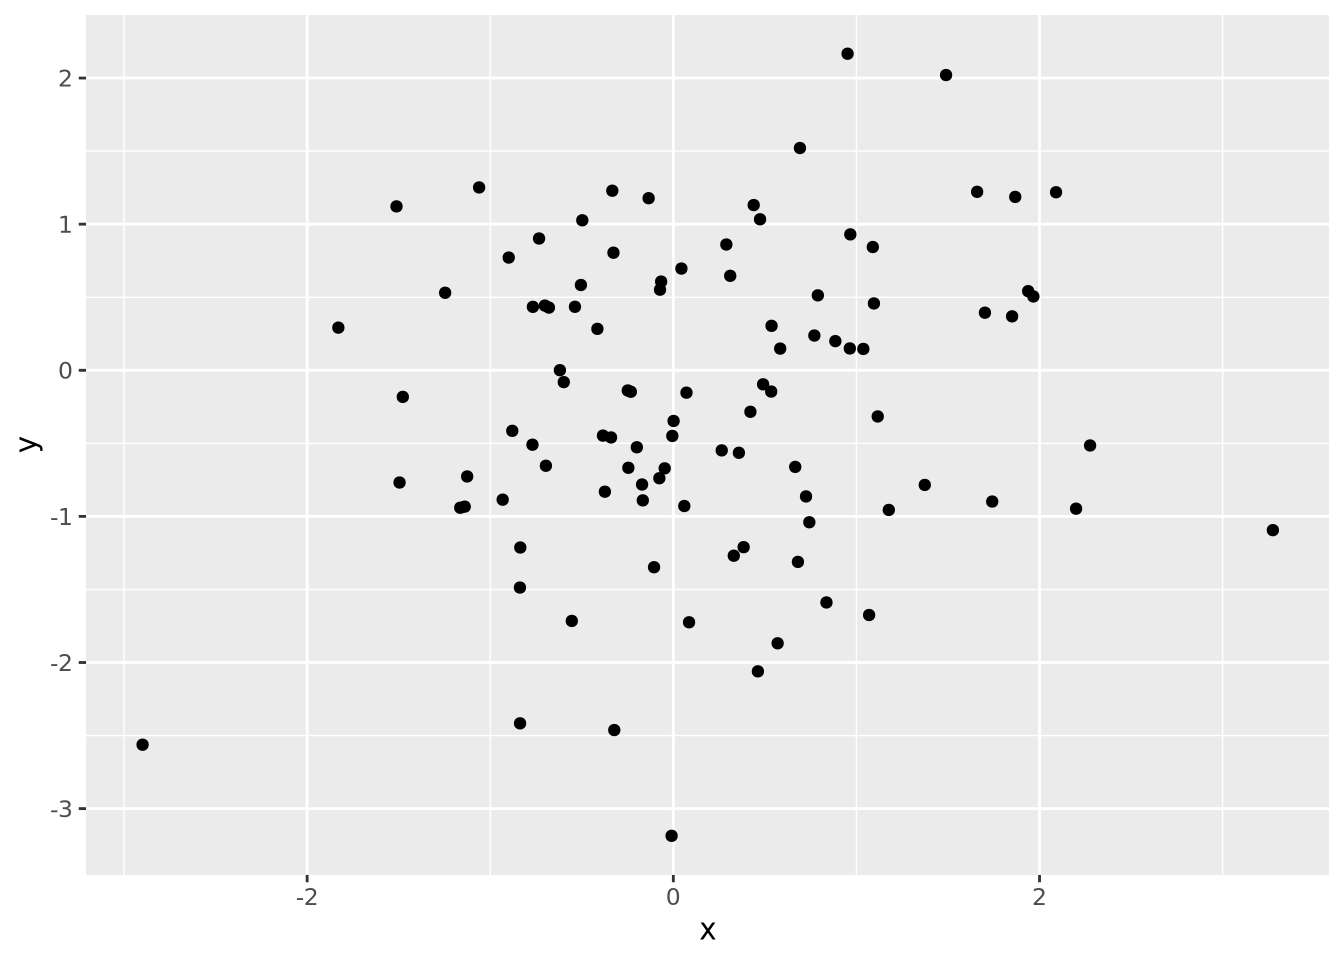
This is fine for displaying on a screen, but if this plot were to be printed on paper, the solid grey background would use unnecessary ink.
There is a helpful principle in plotting: use the least amount of ink possible to produce the desired plot. This is not just for economic, ink-saving reasons, but also because sparser plots without superfluous graphic elements allow the reader to focus more on the data than the styling.
ggplot comes with other themes that may be added to plots with
theme_X() functions.
Another available theme is theme_bw():
base_g + theme_bw()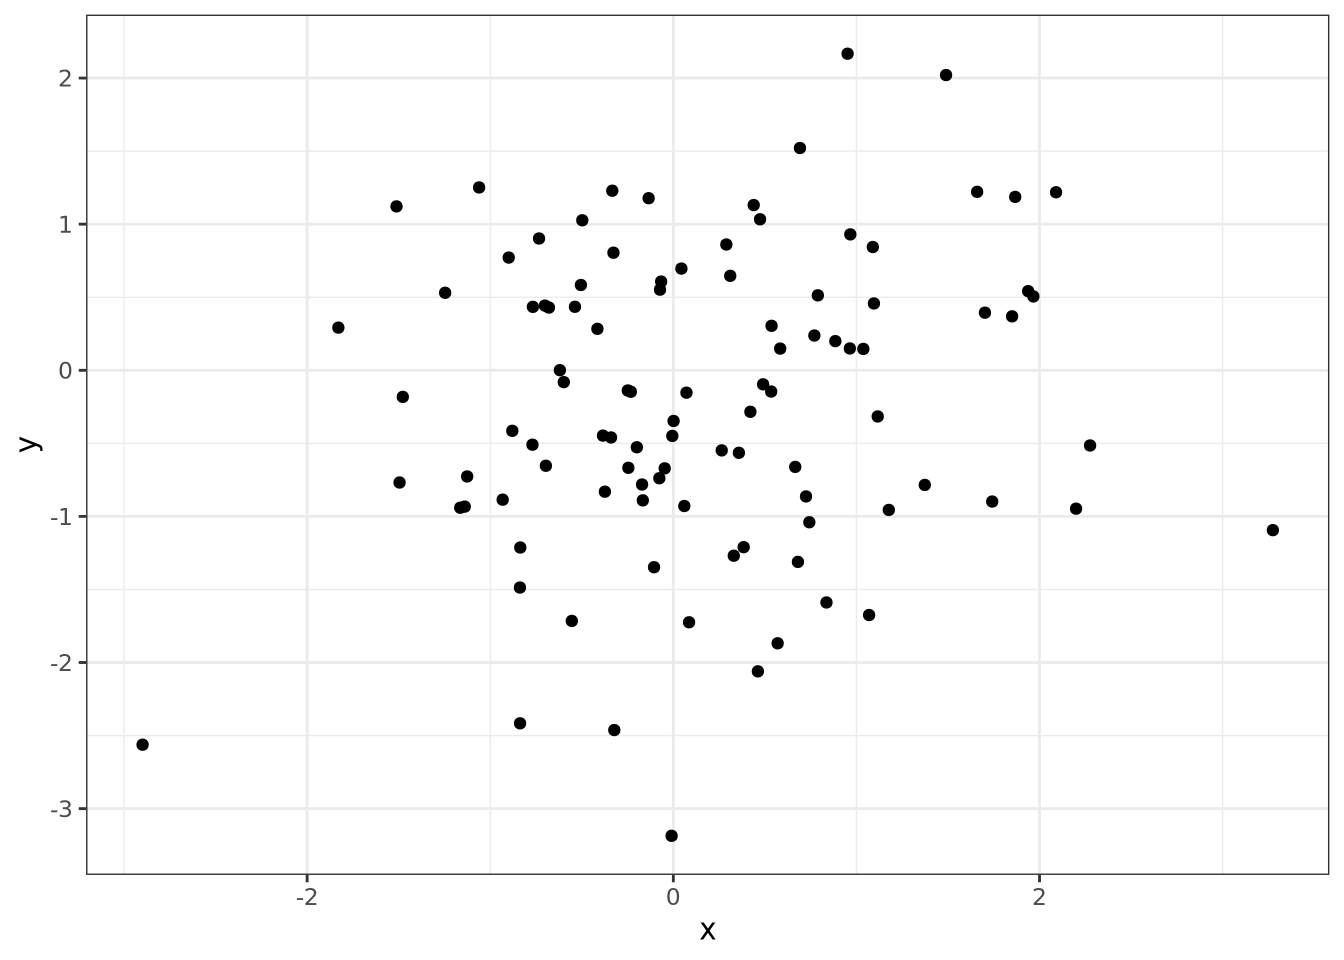
This theme replaces the grey background with white, draws light grey grid lines, and adds a frame around the plotting area. Plots with this theme might be more suitable for plots displayed with a projector, for example in presentations.
Another theme is theme_classic(), which draws only the elements of the plot
that are strictly necessary:
base_g + theme_classic()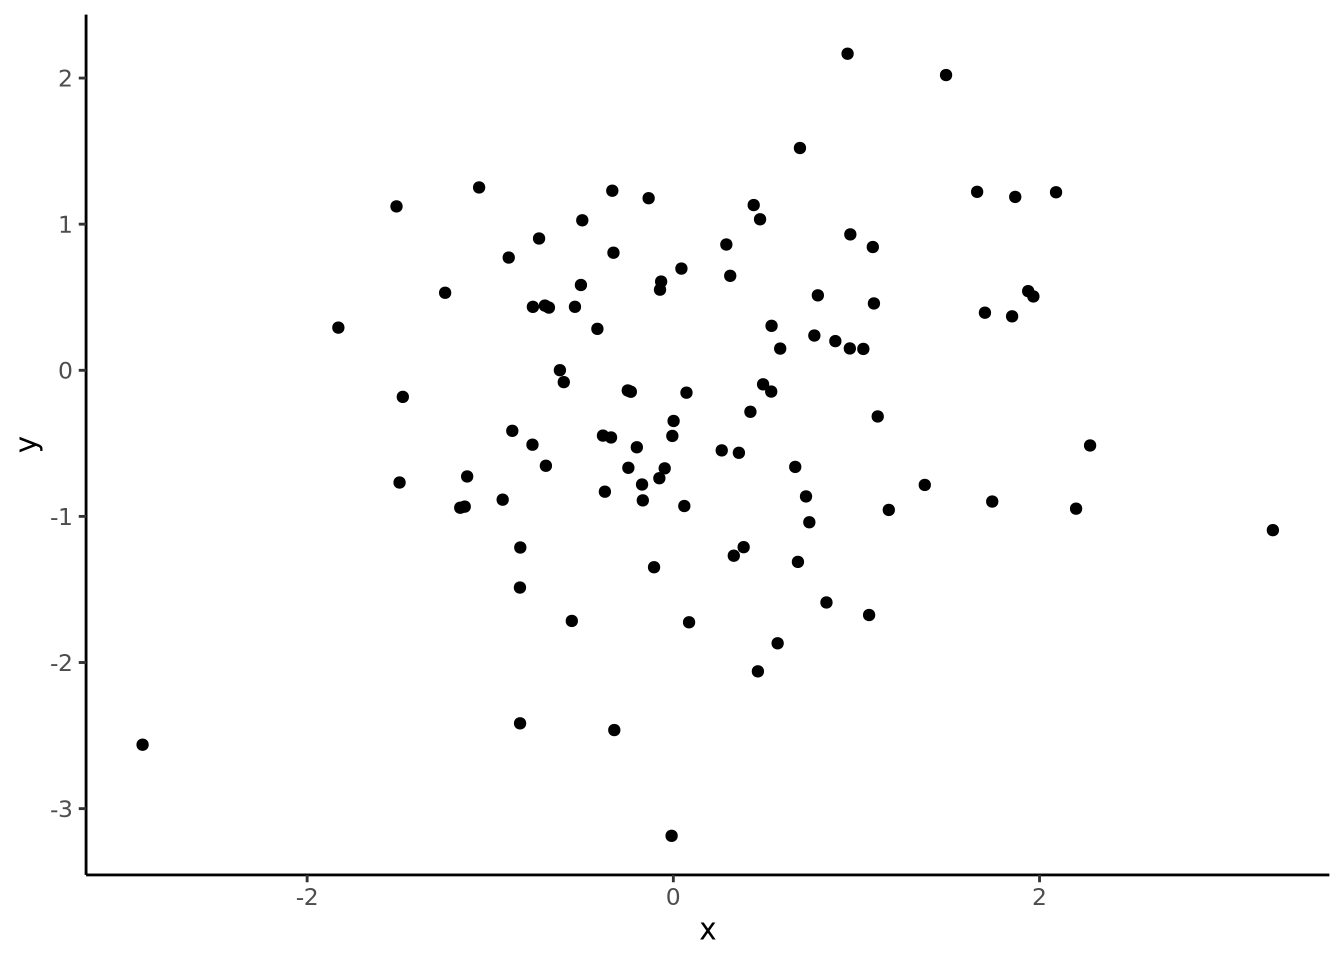
There are many so-called “complete
themes” included with
ggplot. If so desired, all style elements controlled by these complete themes
can be customized using the
theme() function. A full
treatment of themes is beyond the scope of this chapter, but you may read all
about it in the documentation.
7.8.2 Exporting to SVG
Even the custom themes and multipanel figures may not produce figures that adhere to scientific journal guidelines or your own tastes. In these instances, all ggplot plots may be saved in Scalable Vector Graphics (SVG) format. In contrast with bitmapped file formats like PNG or JPG that store images as a matrix of pixels, SVG format describes shapes using a mathematical specification. For example, a circle is expressed in SVG format like:
<circle cx="50" cy="50" r="50"/>This
Another benefit of SVG is that the illustration programs that understand them can also be used to edit the individual elements of the entire plot. For example, the position of text labels, the font, and the text itself, may be arbitrarily modified. Consider the following multipanel figure:
library(patchwork)
g1 <- tibble(
  x=rnorm(100),
  y=rnorm(100)
) %>%
  ggplot(aes(x=x, y=y)) +
  geom_point() +
  theme_bw()

g2 <- tibble(
   x=rnorm(100),
   y=5*x+3+rnorm(100,1,4)
) %>%
  ggplot(aes(x=x, y=y)) +
  geom_point() +
  geom_smooth(method="loess", formula=y ~ x) +
  theme_bw()

g3 <- tibble(
  group=c(rep('A',100),rep('B',100)),
  val=c(rnorm(100,3),rnorm(100,5,3))
) %>%
  ggplot(aes(x=group, y=val,fill=group)) +
  geom_violin() +
  theme_bw()

(g1 / g2) | g3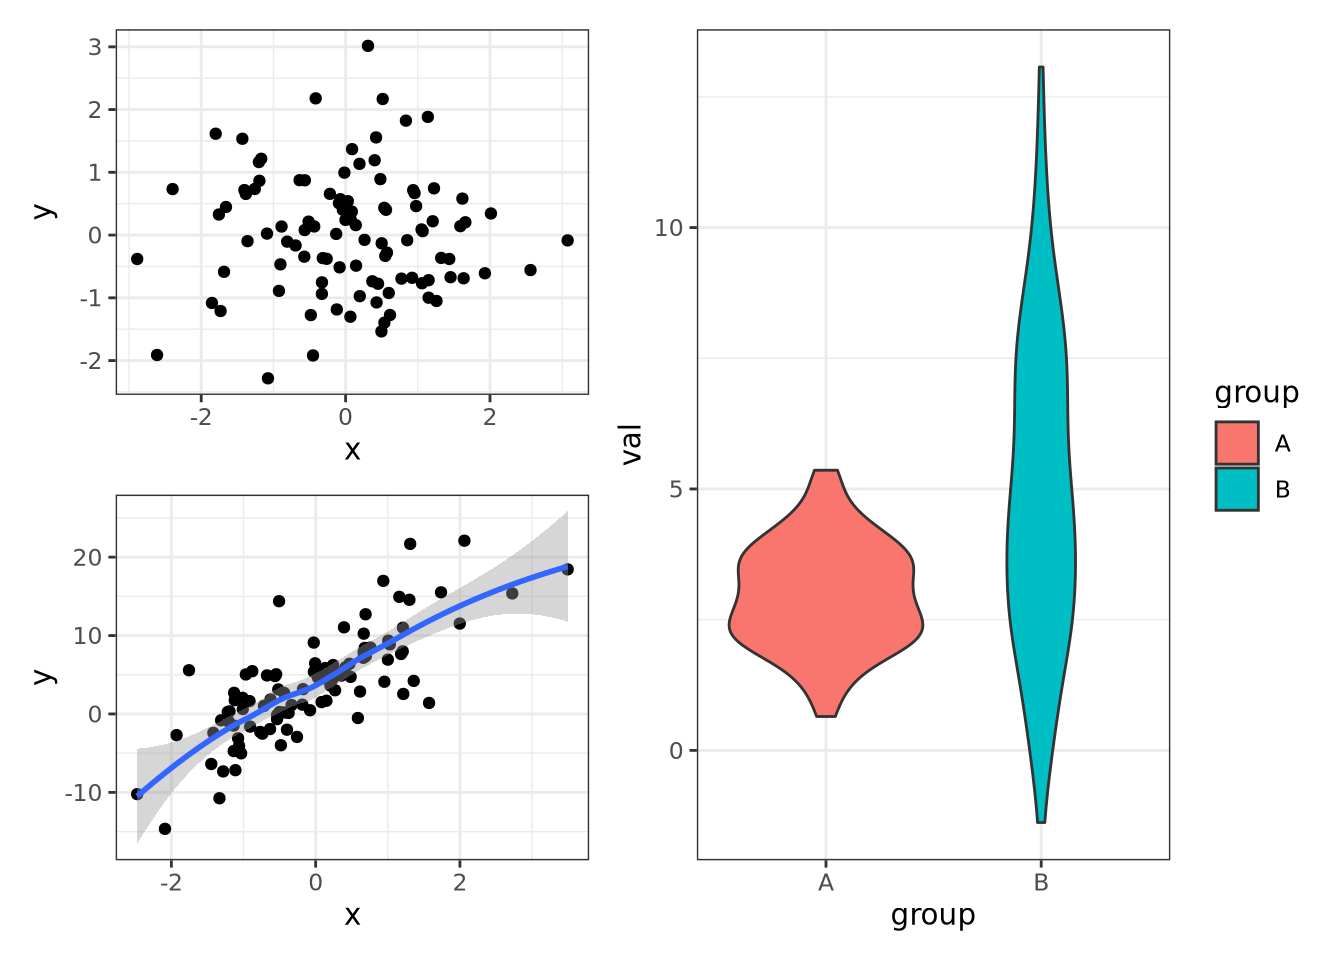
This figure may be saved to SVG format by using the
ggsave() function:
ggsave('multipanel.svg')The image edited in Adobe Illustrator to have a different font and annotations is as follows:
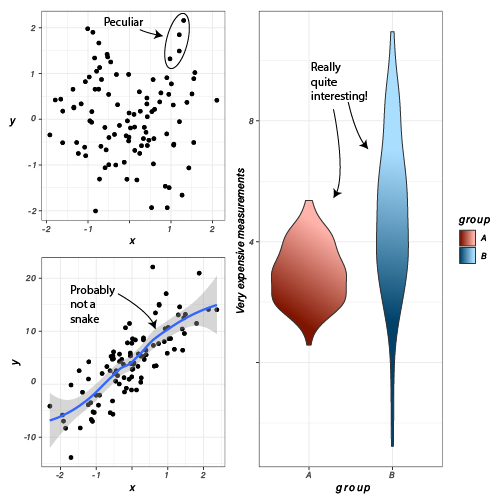
Edited multipanel figure
By combining themes in ggplot with the SVG+illustration software strategy, very high quality and customized figures can be created with relatively little effort.