- Syllabus
- 1 Introduction
- 2 Data in Biology
- 3 Preliminaries
- 4 R Programming
- 4.1 Before you begin
- 4.2 Introduction
- 4.3 R Syntax Basics
- 4.4 Basic Types of Values
- 4.5 Data Structures
- 4.6 Logical Tests and Comparators
- 4.7 Functions
- 4.8 Iteration
- 4.9 Installing Packages
- 4.10 Saving and Loading R Data
- 4.11 Troubleshooting and Debugging
- 4.12 Coding Style and Conventions
- 4.12.1 Is my code correct?
- 4.12.2 Does my code follow the DRY principle?
- 4.12.3 Did I choose concise but descriptive variable and function names?
- 4.12.4 Did I use indentation and naming conventions consistently throughout my code?
- 4.12.5 Did I write comments, especially when what the code does is not obvious?
- 4.12.6 How easy would it be for someone else to understand my code?
- 4.12.7 Is my code easy to maintain/change?
- 4.12.8 The
stylerpackage
- 5 Data Wrangling
- 6 Data Science
- 7 Data Visualization
- 8 Biology & Bioinformatics
- 8.1 R in Biology
- 8.2 Biological Data Overview
- 8.3 Bioconductor
- 8.4 Microarrays
- 8.5 High Throughput Sequencing
- 8.6 Gene Identifiers
- 8.7 Gene Expression
- 8.7.1 Gene Expression Data in Bioconductor
- 8.7.2 Differential Expression Analysis
- 8.7.3 Microarray Gene Expression Data
- 8.7.4 Differential Expression: Microarrays (limma)
- 8.7.5 RNASeq
- 8.7.6 RNASeq Gene Expression Data
- 8.7.7 Filtering Counts
- 8.7.8 Count Distributions
- 8.7.9 Differential Expression: RNASeq
- 8.8 Gene Set Enrichment Analysis
- 8.9 Biological Networks .
- 9 EngineeRing
- 10 RShiny
- 11 Communicating with R
- 12 Contribution Guide
- Assignments
- Assignment Format
- Starting an Assignment
- Assignment 1
- Assignment 2
- Assignment 3
- Problem Statement
- Learning Objectives
- Skill List
- Background on Microarrays
- Background on Principal Component Analysis
- Marisa et al. Gene Expression Classification of Colon Cancer into Molecular Subtypes: Characterization, Validation, and Prognostic Value. PLoS Medicine, May 2013. PMID: 23700391
- Scaling data using R
scale() - Proportion of variance explained
- Plotting and visualization of PCA
- Hierarchical Clustering and Heatmaps
- References
- Assignment 4
- Assignment 5
- Problem Statement
- Learning Objectives
- Skill List
- DESeq2 Background
- Generating a counts matrix
- Prefiltering Counts matrix
- Median-of-ratios normalization
- DESeq2 preparation
- O’Meara et al. Transcriptional Reversion of Cardiac Myocyte Fate During Mammalian Cardiac Regeneration. Circ Res. Feb 2015. PMID: 25477501l
- 1. Reading and subsetting the data from verse_counts.tsv and sample_metadata.csv
- 2. Running DESeq2
- 3. Annotating results to construct a labeled volcano plot
- 4. Diagnostic plot of the raw p-values for all genes
- 5. Plotting the LogFoldChanges for differentially expressed genes
- The choice of FDR cutoff depends on cost
- 6. Plotting the normalized counts of differentially expressed genes
- 7. Volcano Plot to visualize differential expression results
- 8. Running fgsea vignette
- 9. Plotting the top ten positive NES and top ten negative NES pathways
- References
- Assignment 6
- Assignment 7
- Appendix
- A Class Outlines
7.7 Multiple Plots
Sometimes it is convenient to plot multiple sets of data at once. This can be accomplished in two ways: facet wrapping to separate out different subsets of a dataset into plots with shared axes, and adding multiple plots to the same figure.
7.7.1 Facet wrapping
Facet wrapping separates subsets of a dataset into plots with identical axes. This can be useful if different groups of data points overlap and occlude one another. Consider the following dataset with three groups of normally distributed random samples:
library(mvtnorm) # package implementing multivariate normal distributions
nsamp <- 100
data <-  rbind(
    rmvnorm(nsamp,c(1,1),sigma=matrix(c(1,0.8,0.8,1),nrow=2)),
    rmvnorm(nsamp,c(1,1),sigma=matrix(c(1,-0.8,-0.8,1),nrow=2)),
    rmvnorm(nsamp,c(1,1),sigma=matrix(c(1,0,0,1),nrow=2))
)
colnames(data) <- c('x','y')
g_oneplot <- as_tibble(data) %>%
  mutate(
    sample_name=c(rep('A',nsamp),rep('B',nsamp),rep('C',nsamp))
  ) %>%
  ggplot(aes(x=x,y=y,color=sample_name)) +
  geom_point()
g_oneplot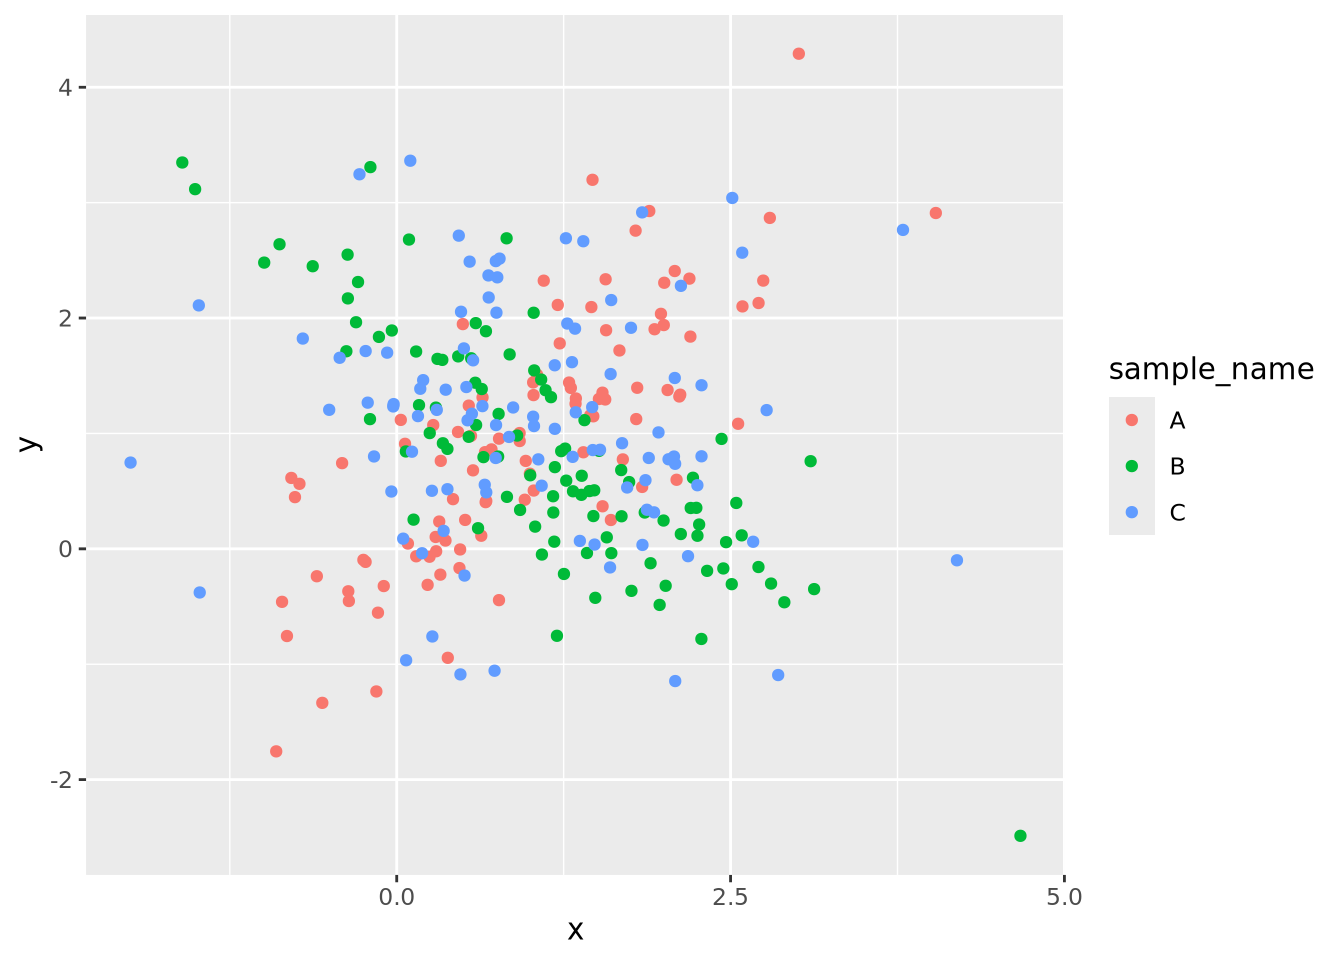
The three sample data points are plotted on top of each other, and although they
are colored differently, it is difficult to discern the patterns of each group
clearly. This same plot may be split into three, one for each sample group,
using the facet_wrap()
function:
g_oneplot + facet_wrap(vars(sample_name))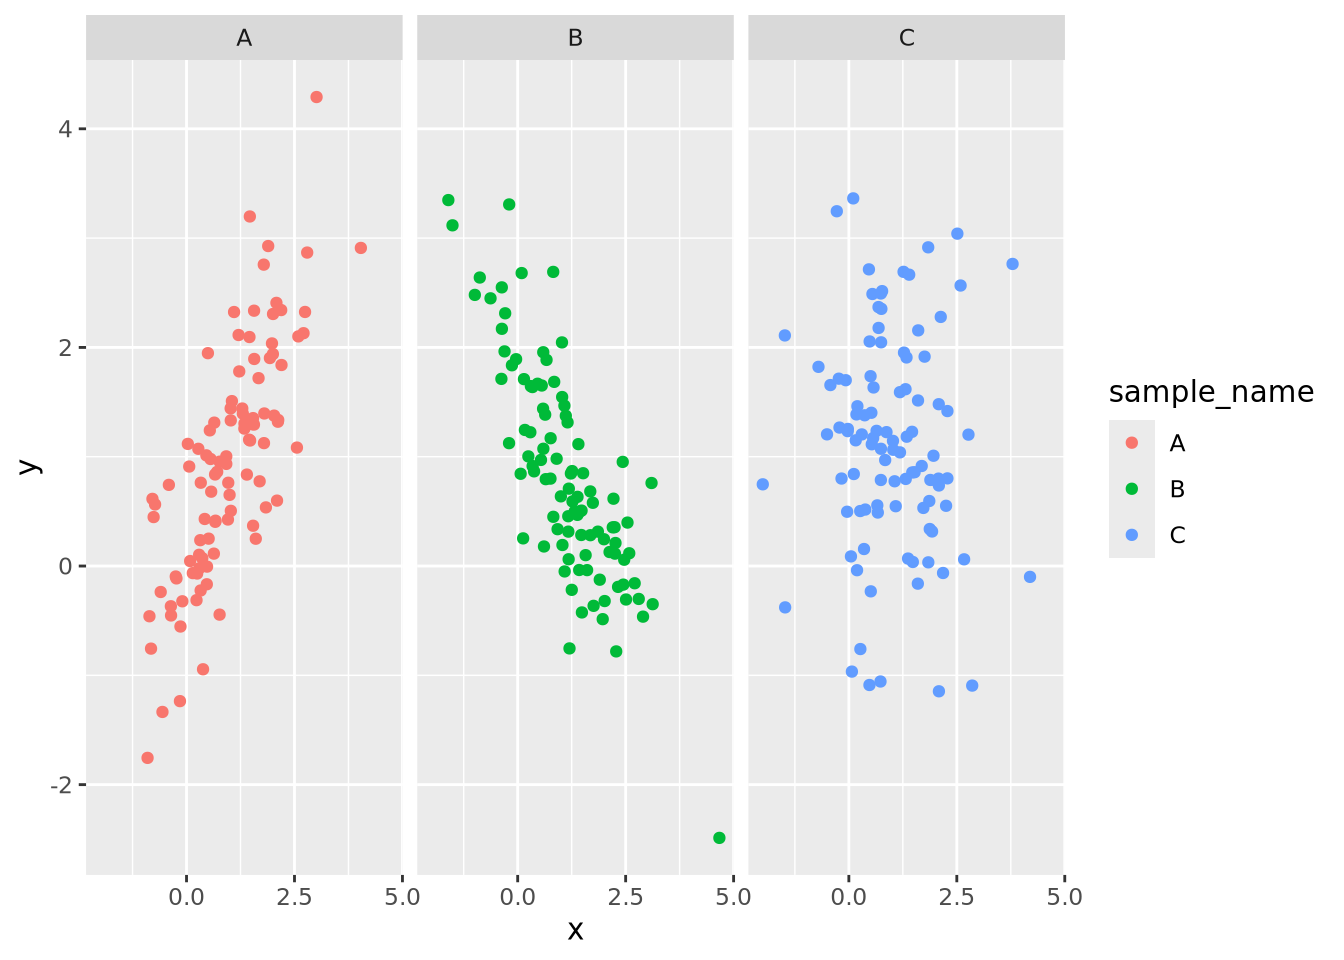
Now the trends of each group are clearly visible. The facet_wrap() function
accepts one required argument, which is the variable name in the data that
should be used to separate the groups decorated by the vars() function. Any
geometry may be used with a facet wrap. For example, we could add a
geom_smooth() to the plot to estimate a smoothing function within each facet:
g_oneplot + facet_wrap(vars(sample_name)) +
  geom_smooth(method="loess", formula=y ~ x)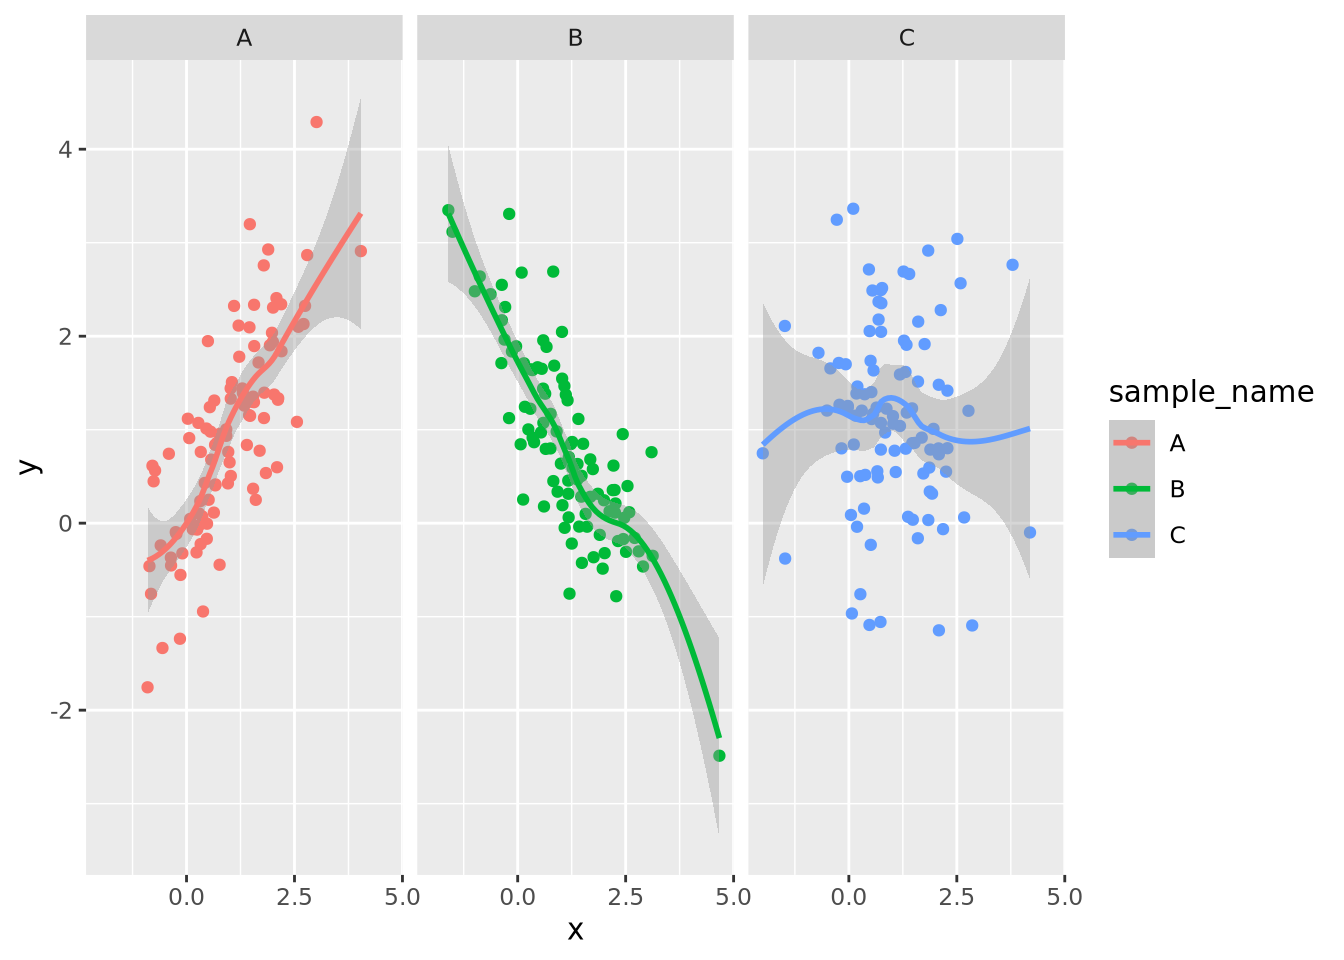
By default, facet wrapping fixes all the axes of each plot to be identical, which enables the most accurate estimates of comparisons between plots according to the Elementary Perceptual Tasks hierarchy. This and many other aspects of the faceting may be adjusted using arguments as described in the documentation.
7.7.2 Multipanel Figures
Facet wrapping is useful when all of the data for the separate plots are on the
same scale, and comaprisons of the facet groups is meaningful. However, faceting
is less convenient when we desire to place plots with unrelated data in the same
figure. The patchwork package allows
us to compose multiple plots together using an intuitive set of operators. For
example, we may put two plots next to each other by separating them with the |
operator:
data <- tibble(
  a=rnorm(100,0,1),
  b=rnorm(100,3,2)
)
g_scatter <- ggplot(data, aes(x=a, y=b)) +
  geom_point()
g_violin <- pivot_longer(data, c(a,b)) %>% ggplot(aes(x=name,y=value,fill=name)) +
  geom_violin()

g_scatter | g_violin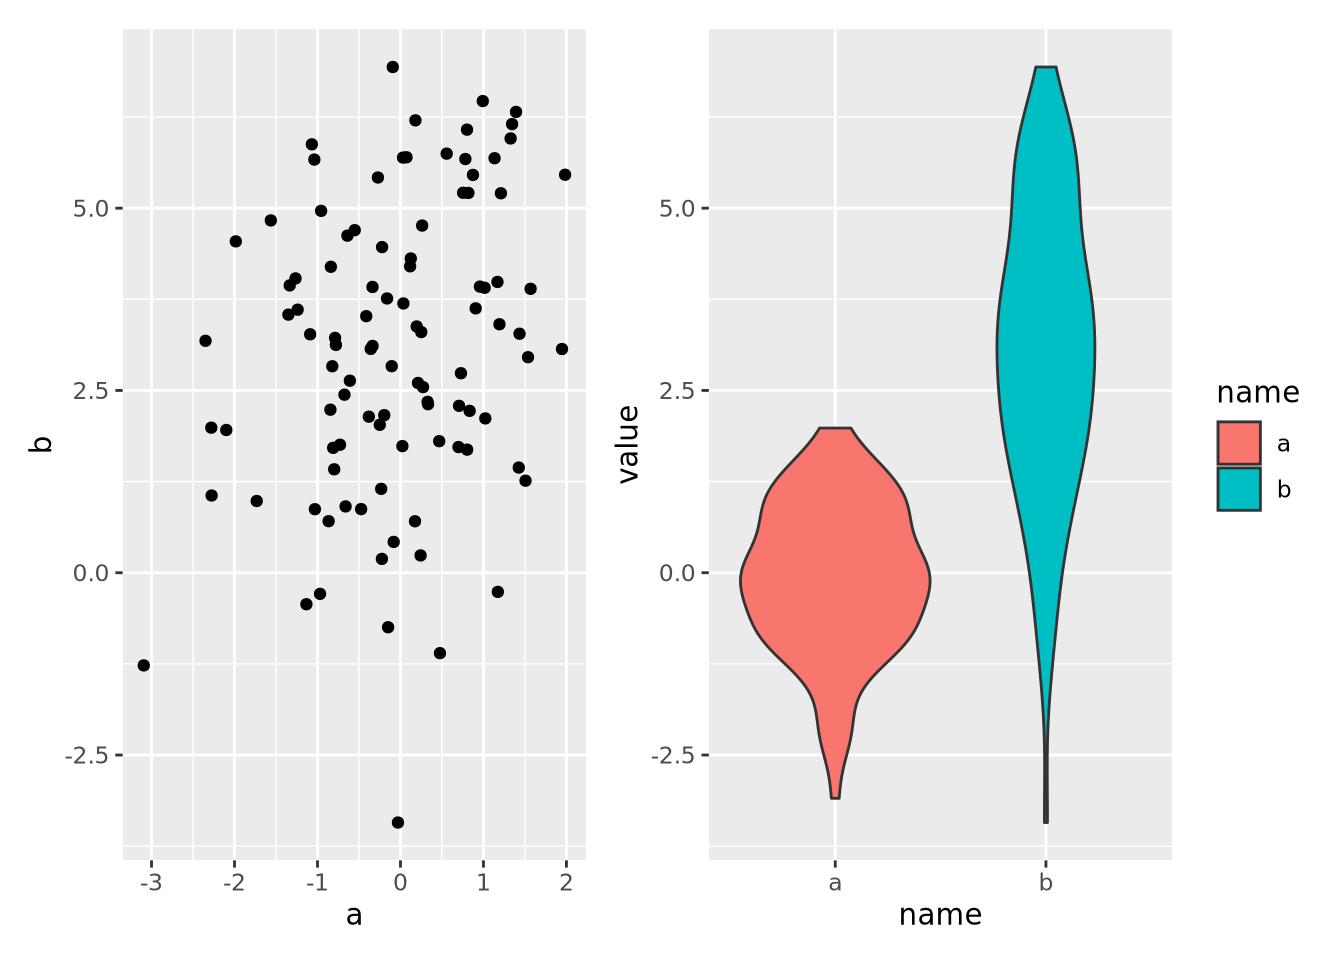
Note that each plot was saved to its own variable and then composed with the
patchwork operator |, which puts the plots side-by-side. We could also place
one plot on top of the other with the / operator:
g_scatter / g_violin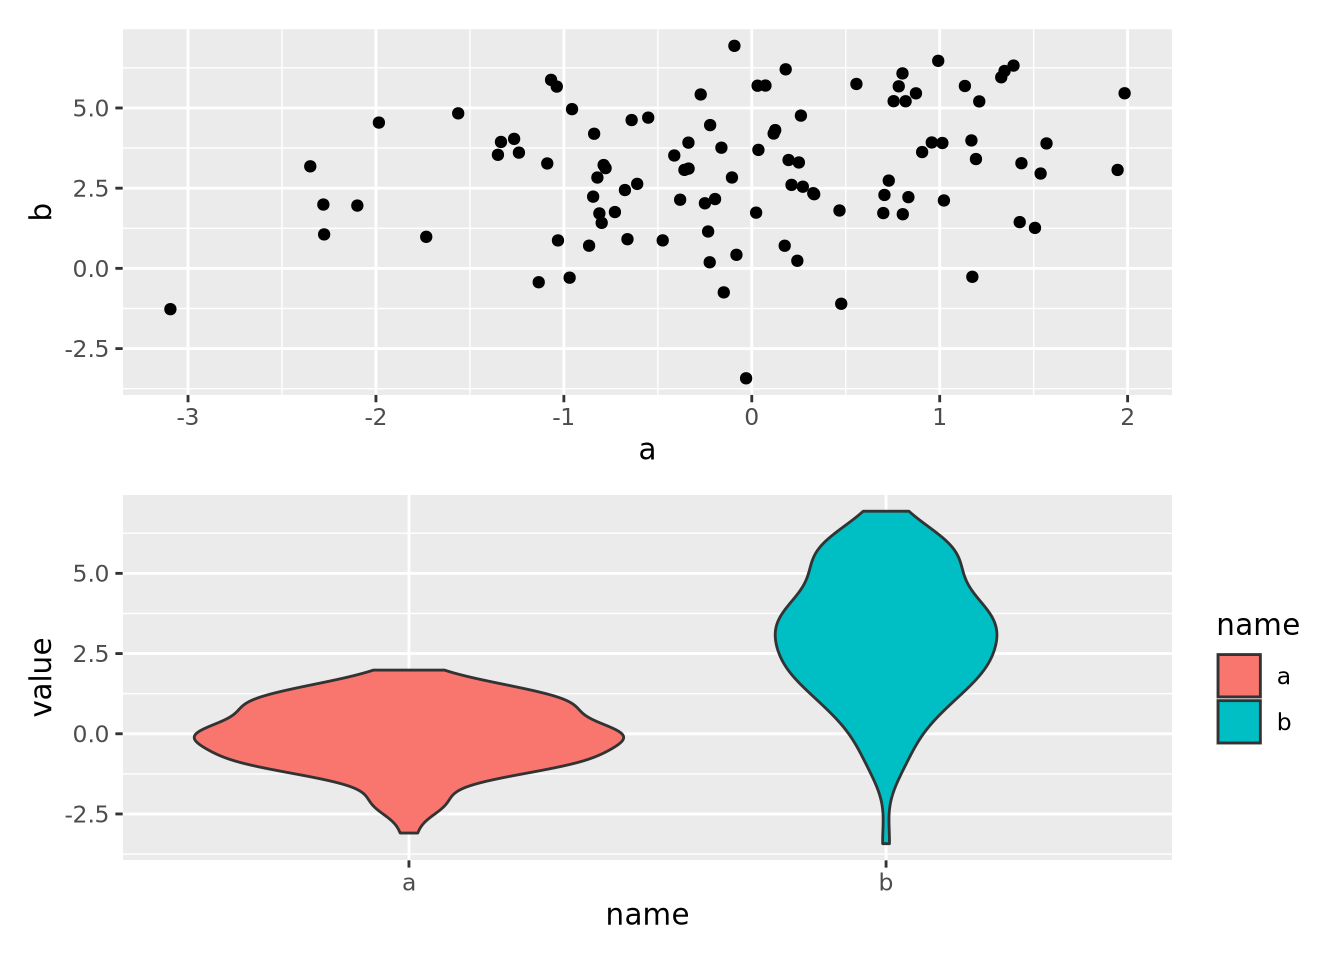
Plots may be composed into arbitrarily complex multipanel figures in this way
using () to group plots together:
g_scatter / ( g_scatter | g_violin)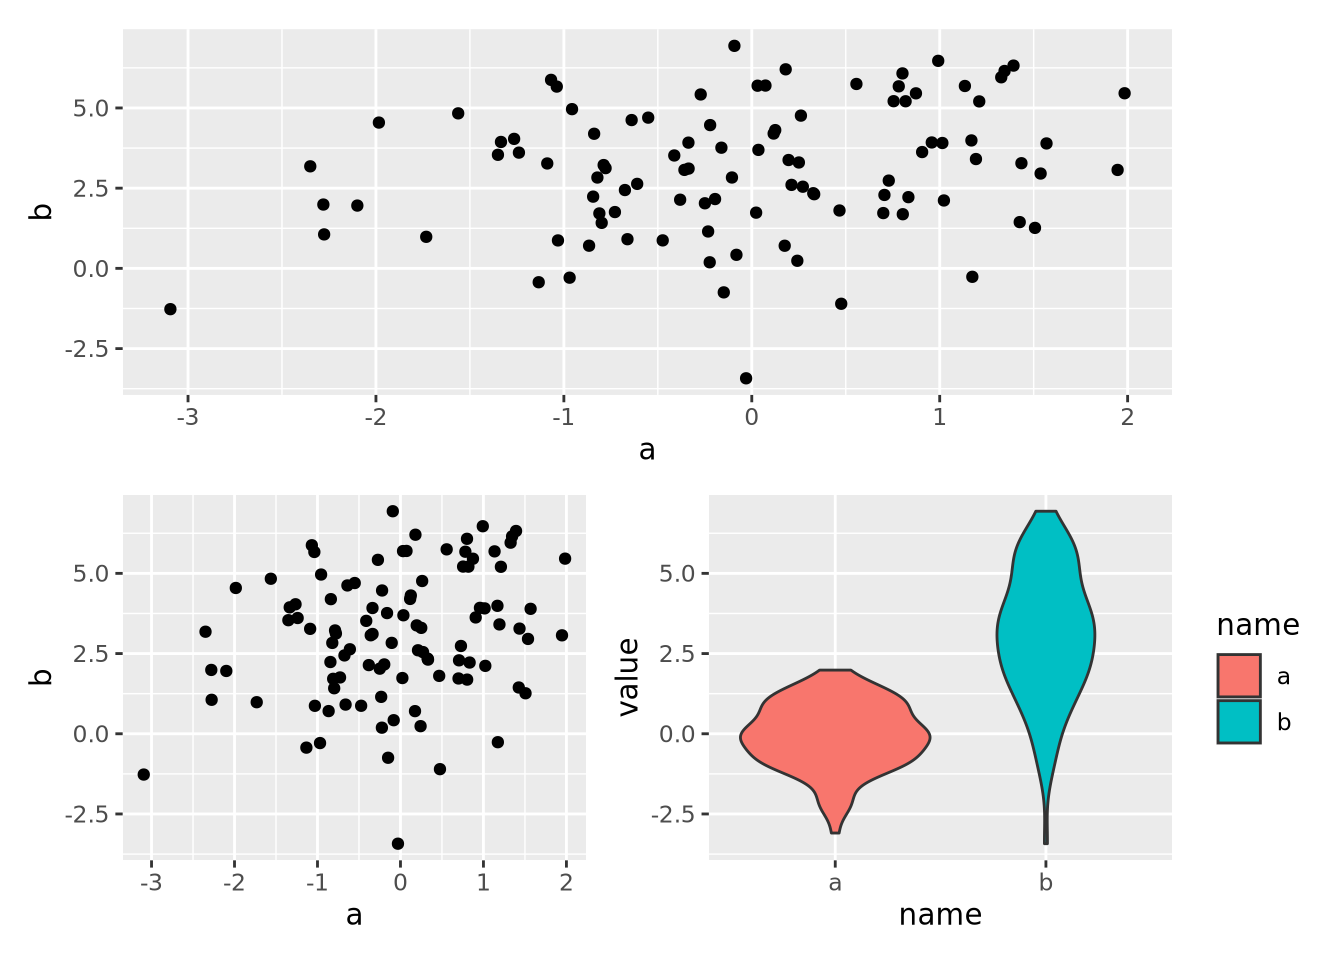
Another possible composition:
(g_scatter / g_scatter ) | g_violin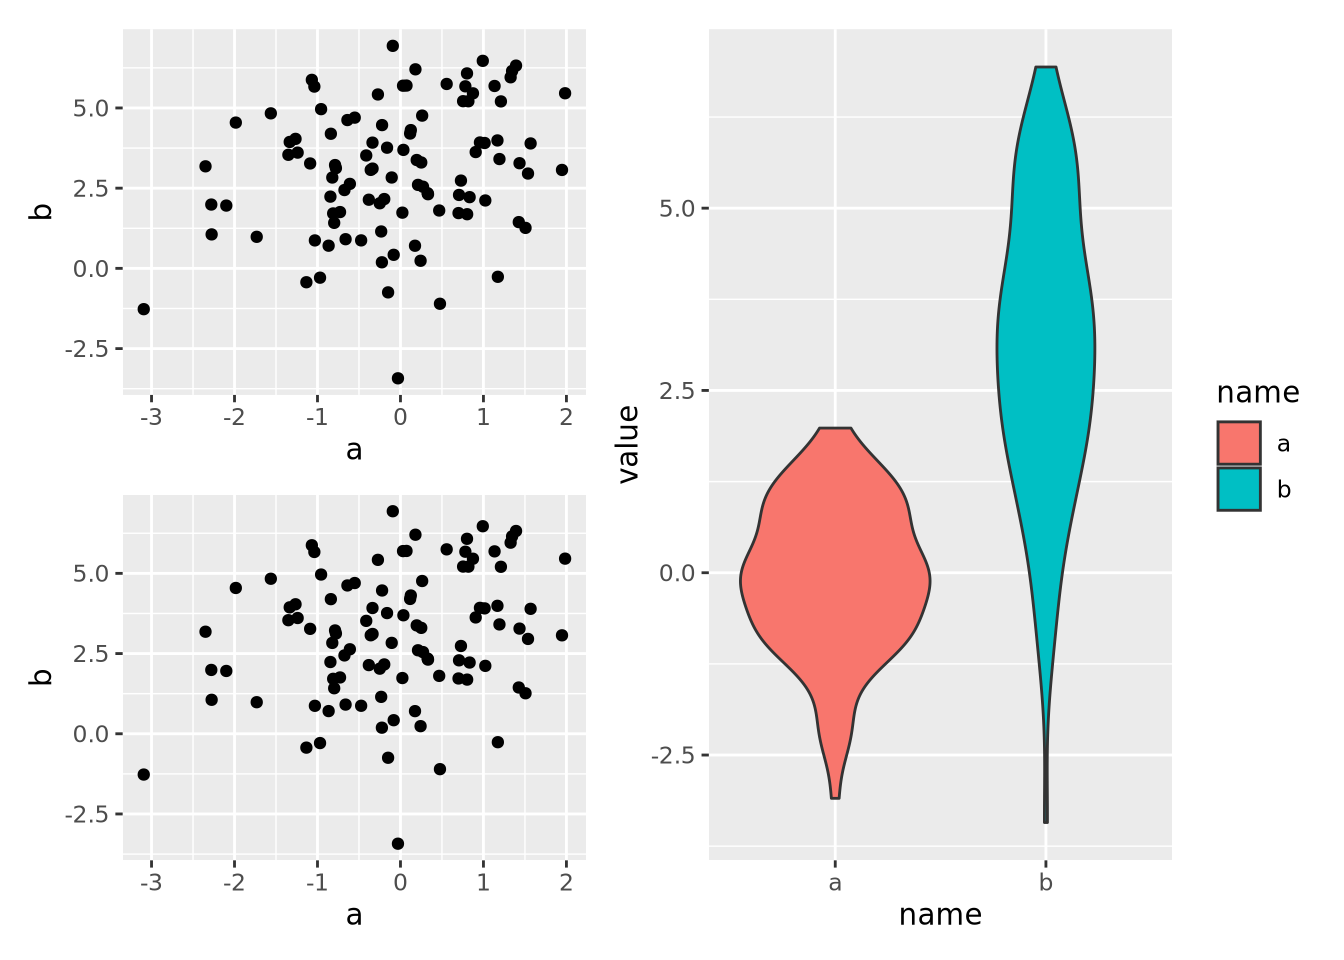
The patchwork library is very flexible, and allows the designer to compose plots in many different ways. These multipanel plots make excellent starting points for producing publication-quality figures, as described in the next section.