Guide for requesting appropriate computational resources on the SCC
As we’ve discussed in class, we can greatly speed up certain computational operations by making use of high performance computing principles. This can include leveraging multicore processors, using nodes with more RAM available and making use of parallel computing to run independent tasks simultaneously on multiple computers.
The compute nodes on the SCC are relatively heterogeneous and you can see an exact technical breakdown here. For operations where it is possible, we will often make use of multiple cores of a processor to speed up the computation.
pe omp
The value of N can be set to any number between 1 and 28 and can also be set to 36. Use N=36 is to request a very large-memory (1024 GB) node. To make best use of available resources on the SCC, the optimal choices are N=1, 4, 8, 16, 28, or 36.
Some more guidance can be found here
Handling memory requests on the SCC
As well as cores, certain jobs may require a specific amount of memory. As you know, storing information in RAM (random access memory) allows for much faster access and operations. When your jobs are scheduled and dispatched to the actual node, there is no actual restriction on the amount of RAM your task utilizes. However, we are on a shared computing cluster, and it is important to be respectful and every user is expected to follow “fair share” guidelines. Your job will likely be running on a node where other user’s tasks are also running, so it is important not to unduly monopolize these shared resources.
Memory options to the batch system are only enforced when the job is dispatched to the node. Once the job has been dispatched, the batch system cannot enforce any limits to the amount of memory the job uses on the node. Therefore each user is expected to follow “fair share” guidelines when submitting jobs to the cluster.
The memory on each node on the SCC is shared by all the jobs running on that node. Therefore a single-processor job should not use more than the amount of memory available per core (TotalMemory / NumCores where TotalMemory is the total memory on the node and NumCores is the number of cores). For example on the nodes with 128GB of memory and 16 cores, if the node is fully utilized, a single-processor job is expected to use no more than 8GB of memory. See the Technical Summary for the list of nodes and the memory available on each of them.
More instructions can be found here
Commonly used core / memory options on the SCC
In general, requesting more cores (or more memory), will increase your queue
time as these more powerful nodes are usually in high demand by other users of
the SCC. You can look at the nextflow.config profiles section to look at
exactly the resources requested via qsub command for each of the labels we are
using for our tasks.
Below, you can see a small table provided by the SCC that denotes common memory and processor requests and how to specify them:
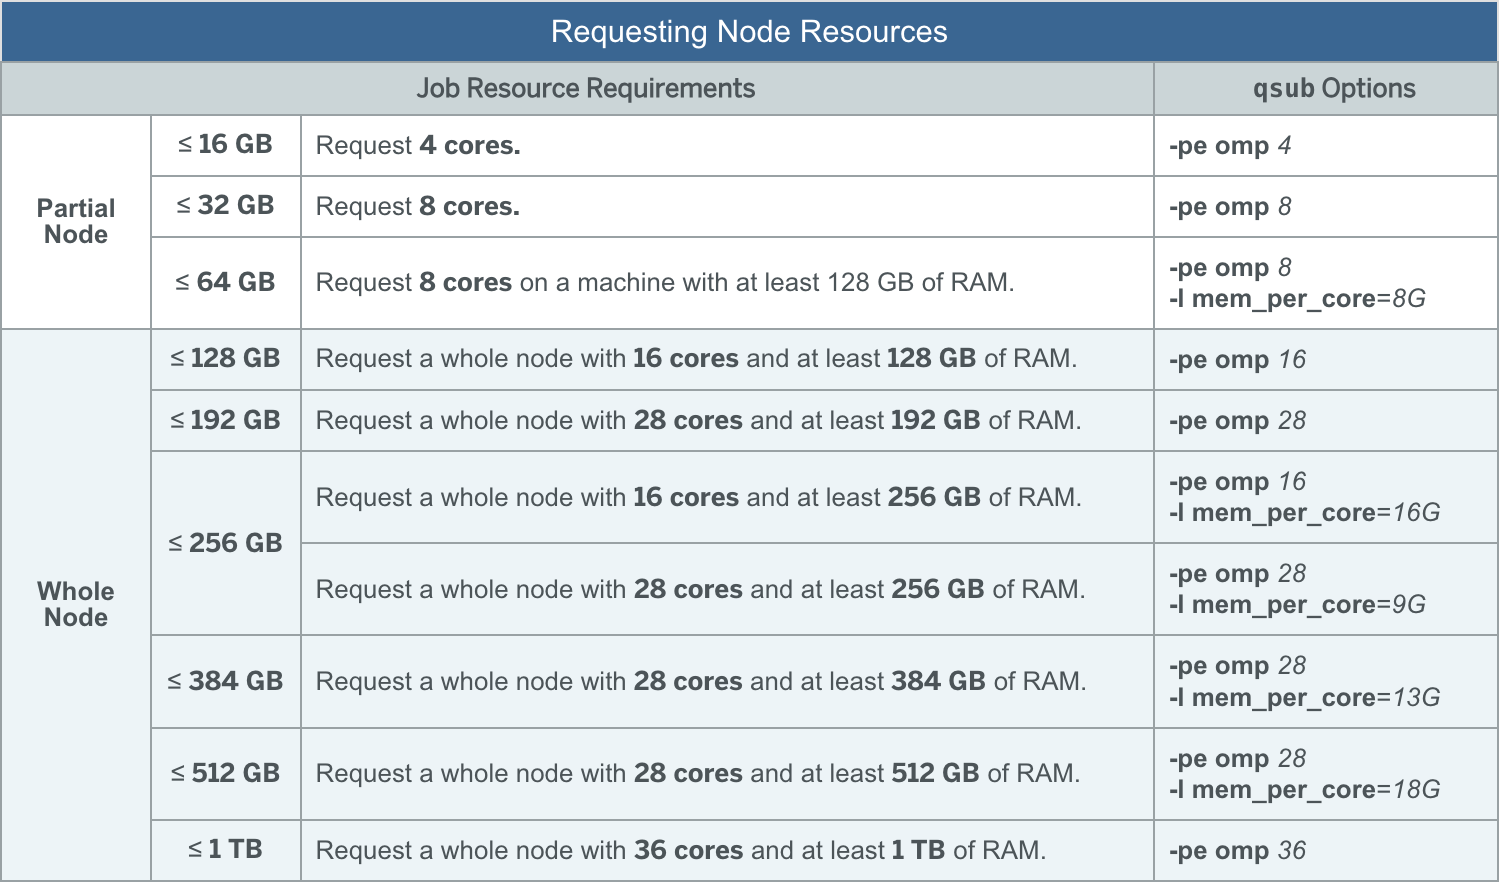
A few important notes on the table seen above:
-
These are the most common options, and the job queue will generally be faster when using the preset options seen above as there are more nodes with these specifications.
-
The more powerful nodes (larger # of cores and RAM) are in high-demand. You want to only request these nodes if you are sure you need the resources these provide. The queue for these nodes can be very long and depending on the complexity of the request task, may be longer than the actual runtime of what you are doing.
How to determine what resources to request per job
Determining how many threads / how much RAM your specific analysis will require will largely come with experience. Before you develop this sense, you will need to manually inspect your analyses as they run to determine how many resources they are utilizing. While this is not as critical when working in this class (the scc is free), requesting the appropriate number of resources will be far more important when working in other settings where compute time and resources will be charged per usage.
Requesting resources with Nextflow
We will be using the labels and profiles defined in the nextflow.config file to
specigy the resources we want to request for each process. You have been provided
a few default process labels (process_low, process_medium, process_high) that will
request increasing amounts of resouces. You can view the exact specifications for
these labels in the nextflow.config file.
For all of your nextflow processes, apply an appropriate label based on the amount of resources you estimate your process will require. If you are not sure, you can try running the process, inspecting the resources it is using during runtime, and adjusting the resources accordingly.
If you need, you can also add new labels to the nextflow config file to request additional resources. Please refer to the syntax in the config file and also the SCC documentation for available hardware options above
For example, if you wanted to make a new label that requested 16 cores and at least 256GB of memory, you could add the following to the nextflow config file:
withLabel: process_high {
                    cpus = 16
                    clusterOptions = "-P bf528 -l mem_per_core=16G"
                    memory = "256G"
}
Remember to also make sure you instruct the utility or tool to make use of the resources you have requested. Most utilities will have flags that allow you to specify the number of cores to use or the amount of memory to use.
You can use the $task.cpus and $task.memory variables to specify the number of cores and memory to use inside the actual nextflow process. For example, if you take the following process:
process INDEX {
    label 'process_high'
    conda 'envs/star_env.yml'

    input:
    path genome
    path gtf

    output:
    path "star", emit: index

    script:
    """
    mkdir star
    STAR --runThreadN $task.cpus
    """
}
This would instruct the STAR alignment tool to use the number of cores requested by the process. It finds the value of $task.cpus from the label and the values defined in the nextflow config file.
Managing your batch jobs on the SCC
qstat
Please see this resource from BU SCC IT for detailed information on tracking
your batch jobs using qstat
After you’ve submitted a batch job, you will be able to check the status of any job by using the following command:
qstat -u <your-BU-userid>
To get detailed information about the resources a job is utilizing, you may use the following command:
qstat -j <job ID>
This resource
from the BU SCC IT group describes briefly the output of the above command. One
of the important metrics to note is the maxvmem output, which displays the
maximum amount of virtual memory used during the CPU runtime of the job. This
value should enable you to determine how much memory to request for similar
operations on similarly sized data.
qdel
If you wish to delete a job from the queue, you may use the following command:
qdel <job-id>
The job ID for a specific job may be found by using the above qstat command
If you wish to delete all of the jobs associated with your username, you may use the following command:
qdel -u <your-BU-userid>